Reproducibility in cognitive neuroscience: What is the problem?
Stanford University
A search for “fMRI” for FY2024 NIH grants finds:
1816 matching grants
$941M total costs
What is the brain dysfunction in major depression?
Meta-analysis of 99 published studies
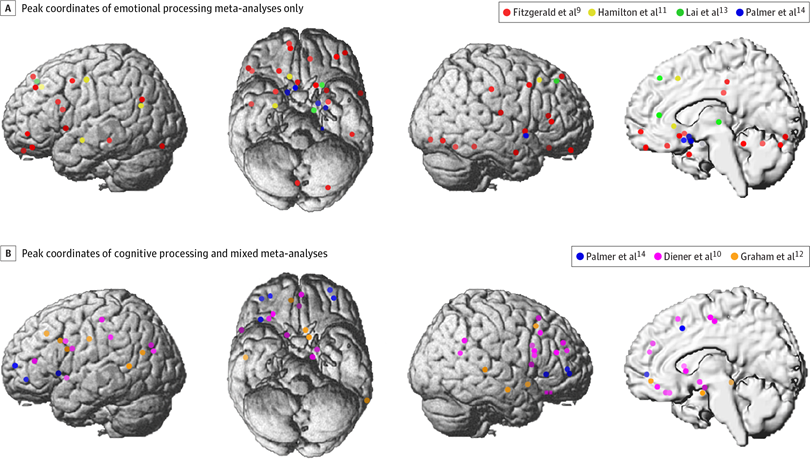
Muller et al, 2017, JAMA Psychiatry



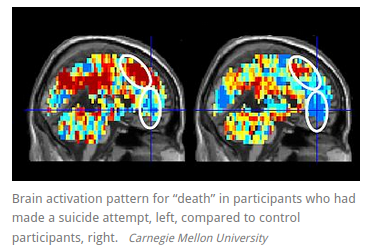
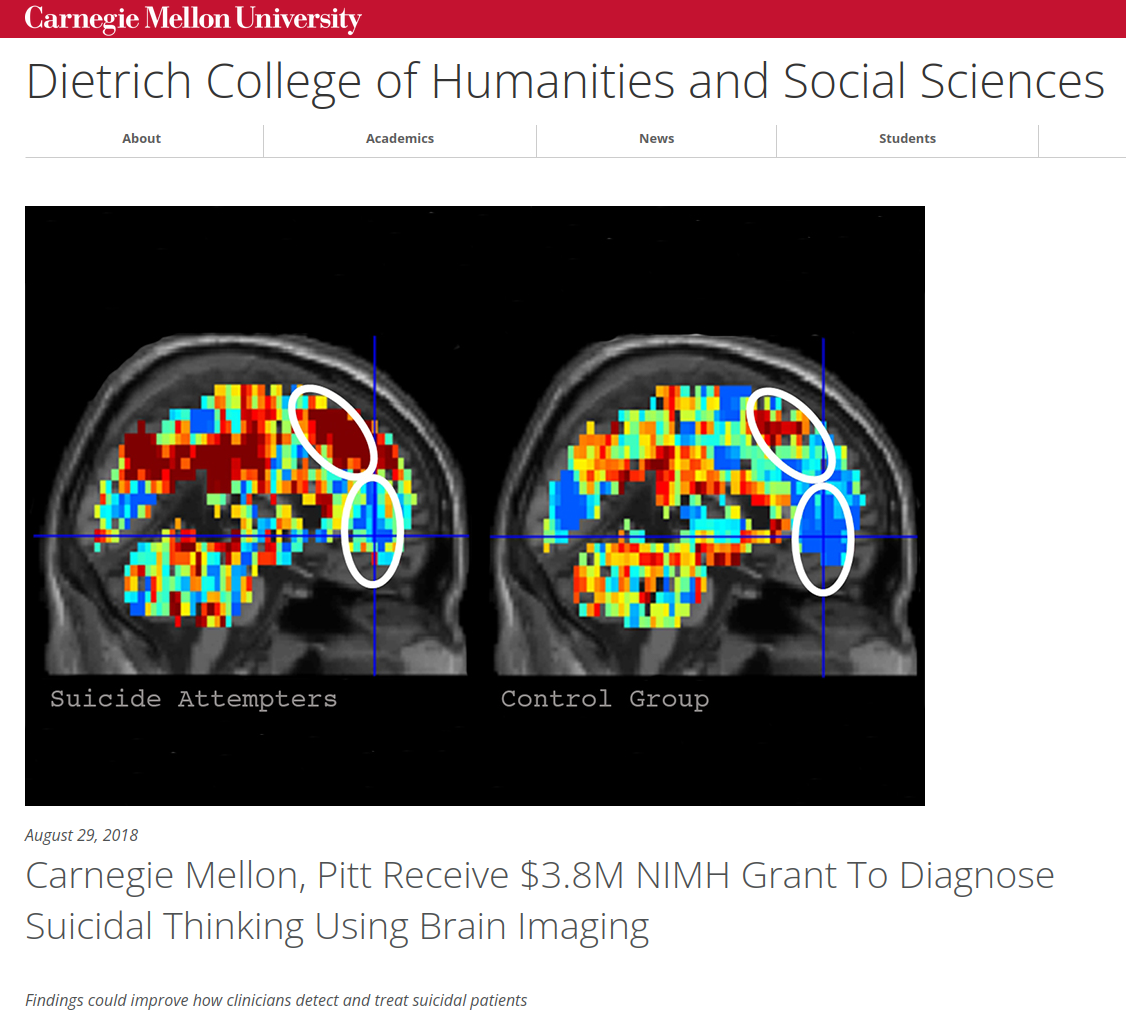
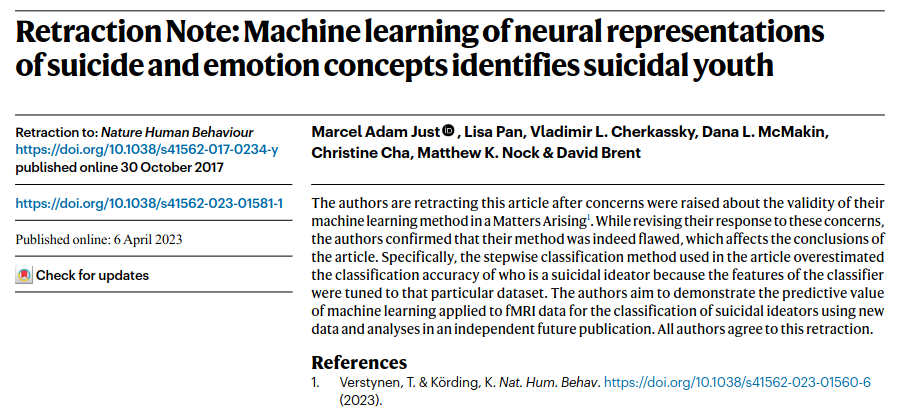

We seem to have created quite a mess.
How can we fix it?
“Sunlight is said to be the best disinfectant”
(Louis Brandeis)
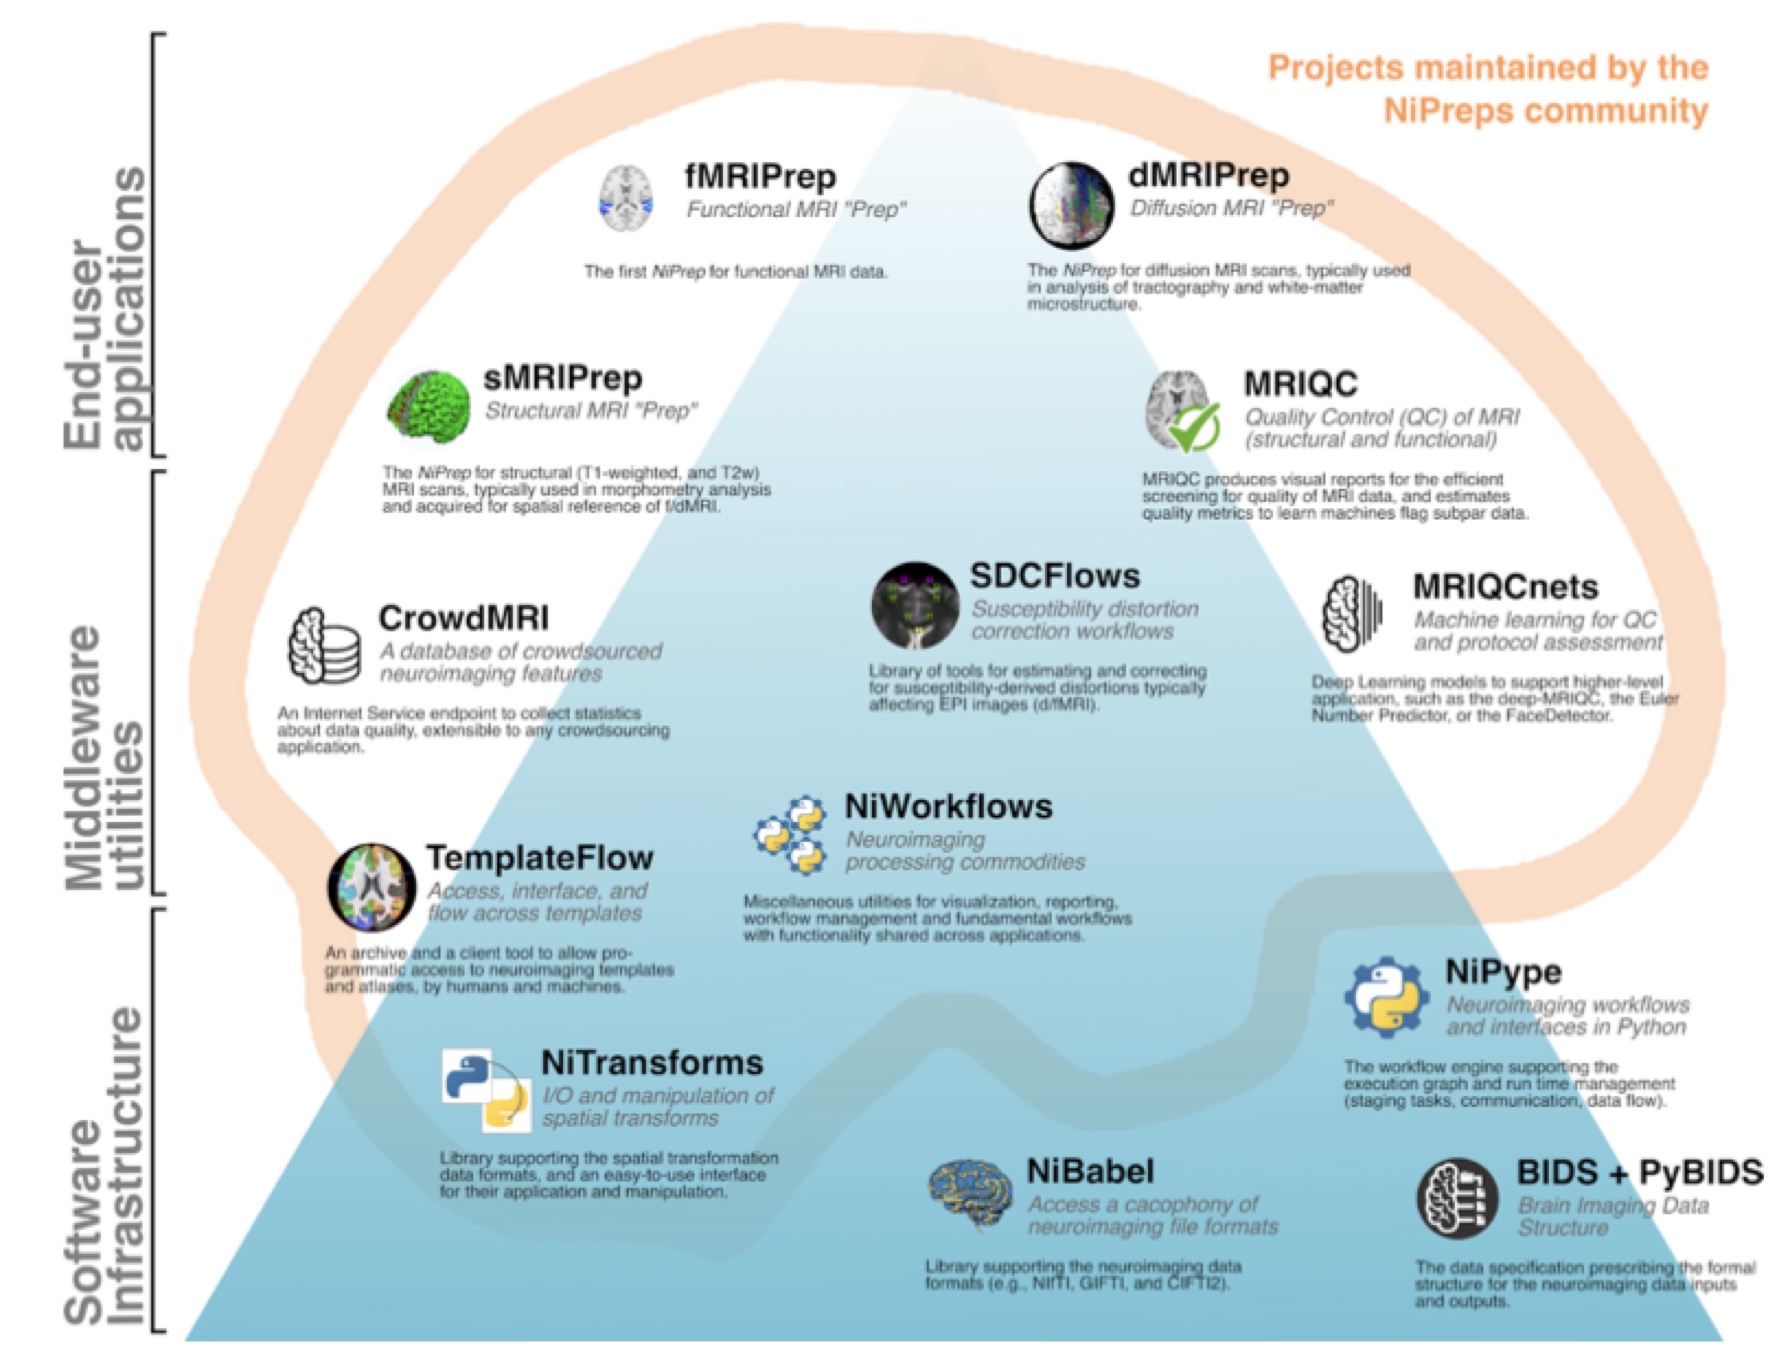
Towards an ecosystem for open and reproducible neuroscience

Designing a more reproducible scientific enterprise

Designing a more reproducible scientific enterprise


82 | NATURE | VOL 526 | 8 OCTOBER 2015
Improving the choice architecture of science
- Choice architecture
- particular set of features that drive people toward or away from particular choices
- Nudges
- Improving incentives
- Using the power of defaults
- Providing feedback
- Expecting and prevent errors


- The smaller the studies conducted in a scientific field, the less likely the research findings are to be true.
Neuroscience research is badly underpowered
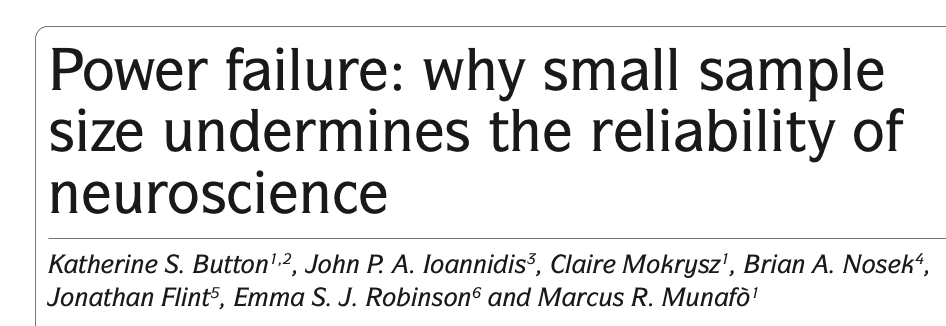

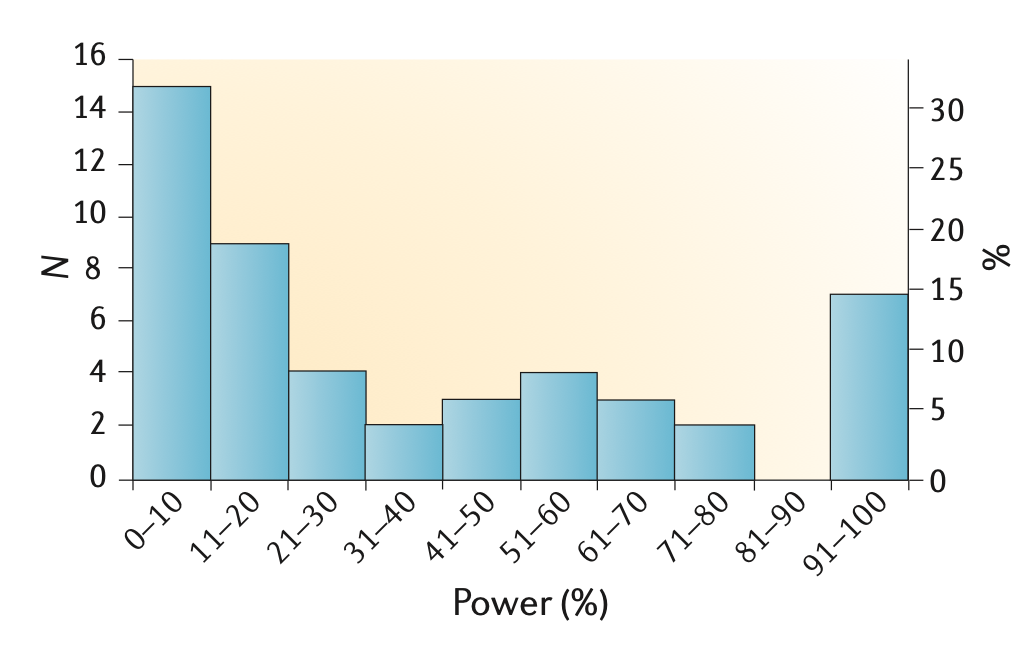
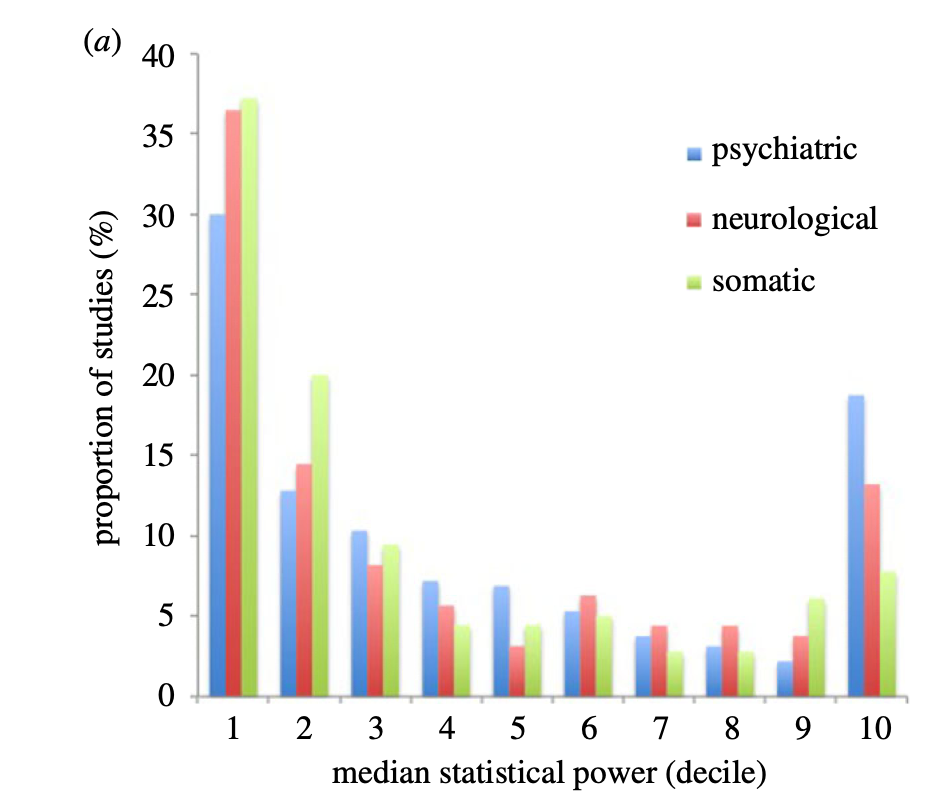
Low power -> unreliable science
Positive Predictive Value (PPV): The probability that a positive result is true
Winner’s Curse: overestimation of effect sizes for significant results

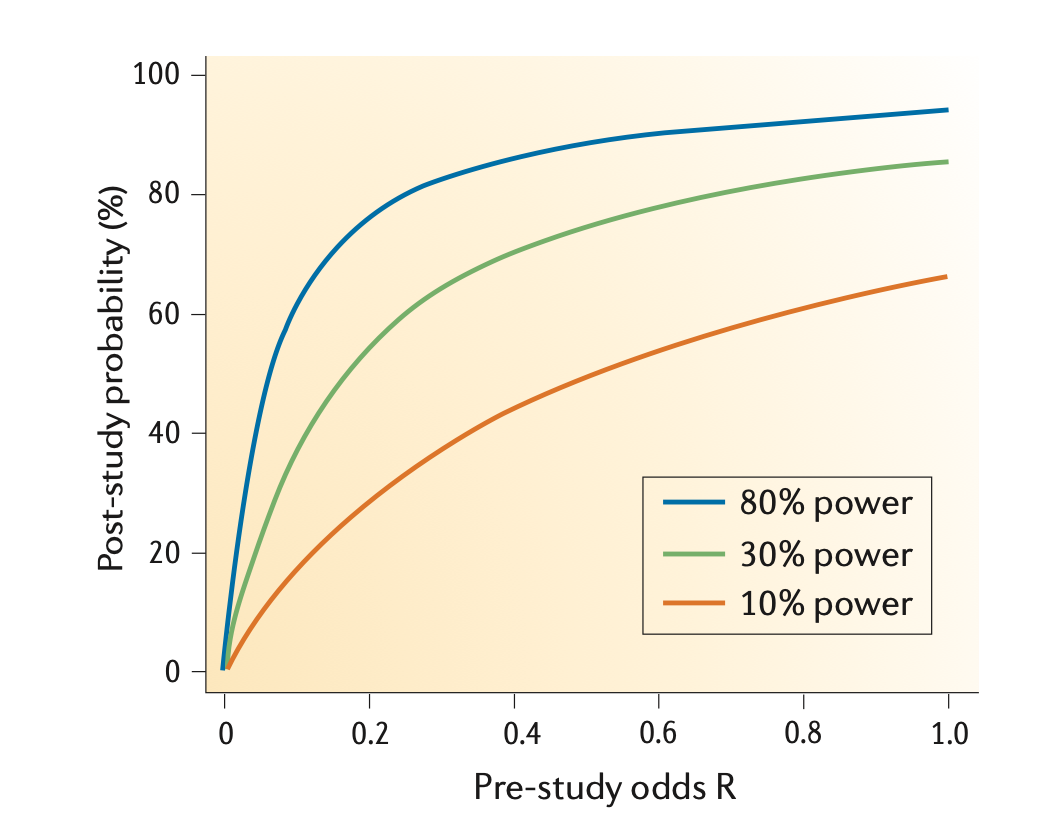
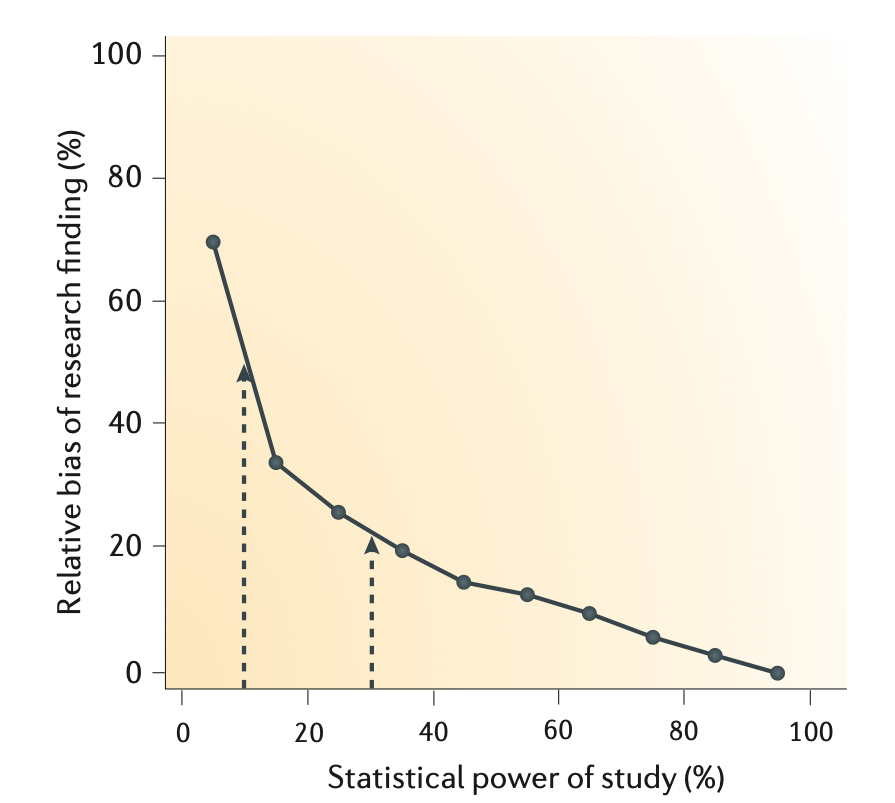
Button et al, 2013
Small samples = high instability of statistical estimates
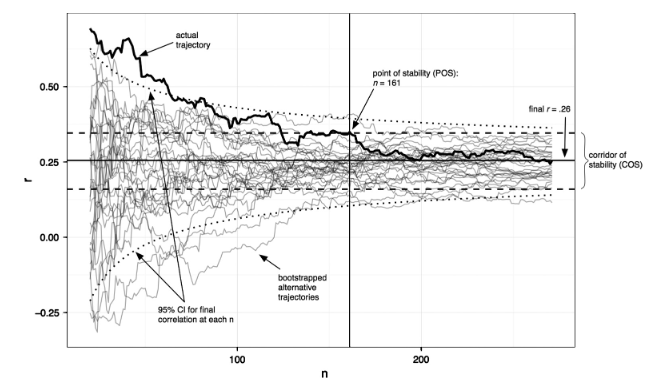
Schonbrodt & Perugini, 2013
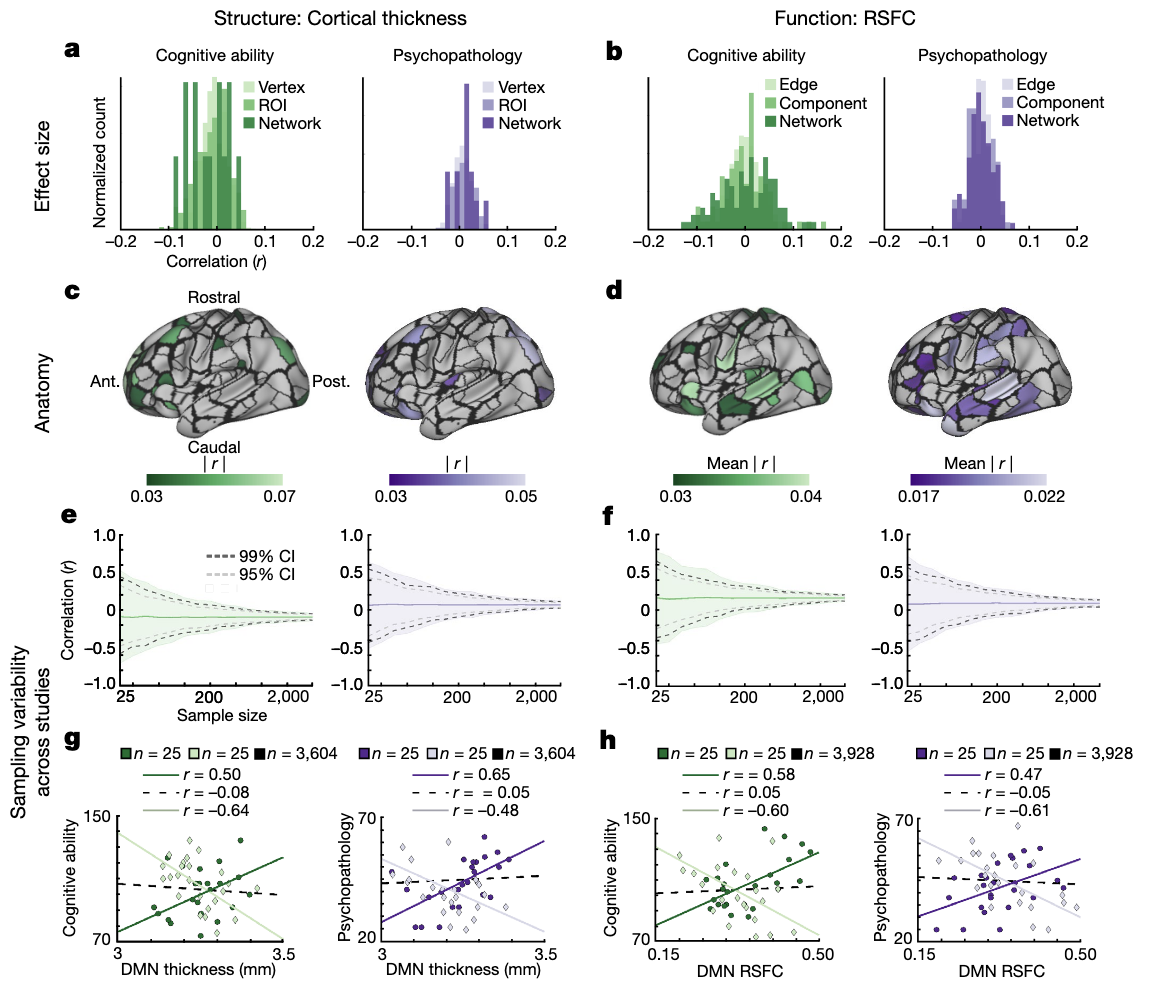
Marek et al., 2022
Small samples + publication bias: the case of candidate genes

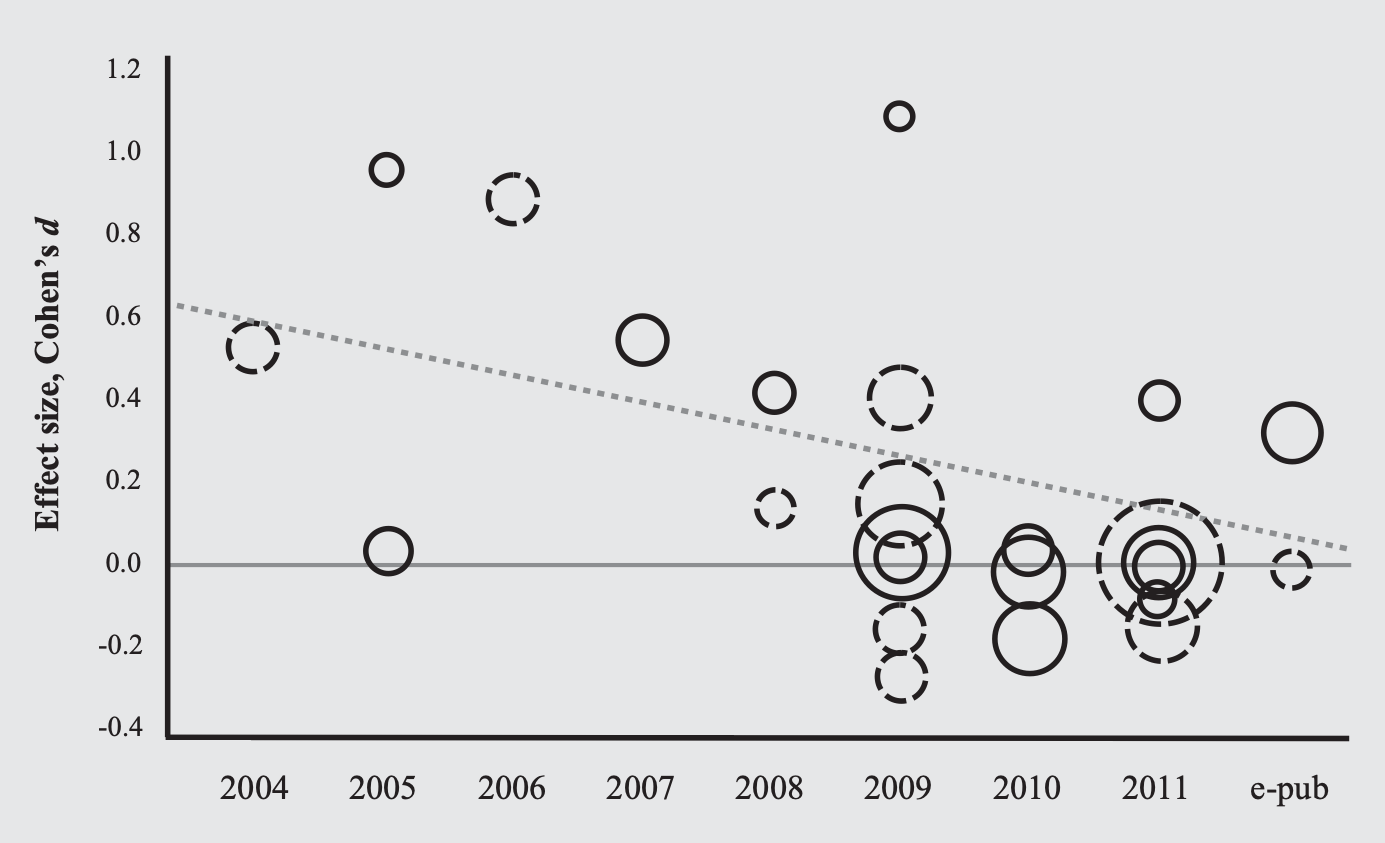
Candidate gene associations fail in well-powered GWAS
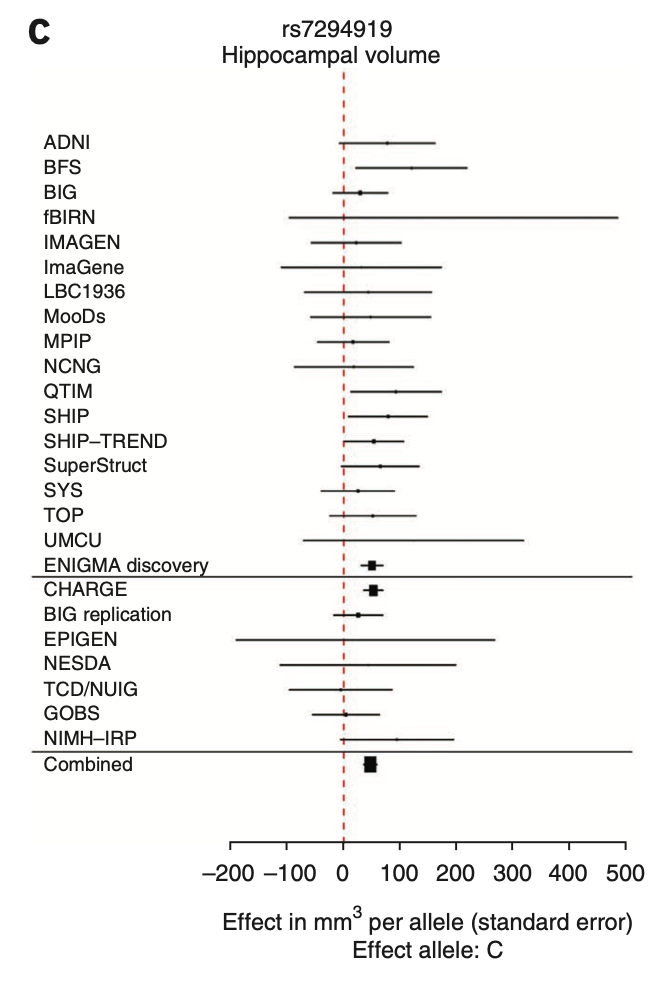

Jason stein et al. for the ENIGMA Consortium

“In general, previously identified polymorphisms associated with hippocampal volume showed little association in our meta-analysis (BDNF, TOMM40, CLU, PICALM, ZNF804A, COMT, DISC1, NRG1, DTNBP1), nor did SNPs previously associated with schizophrenia or bipolar disorder”
How well powered are fMRI studies?
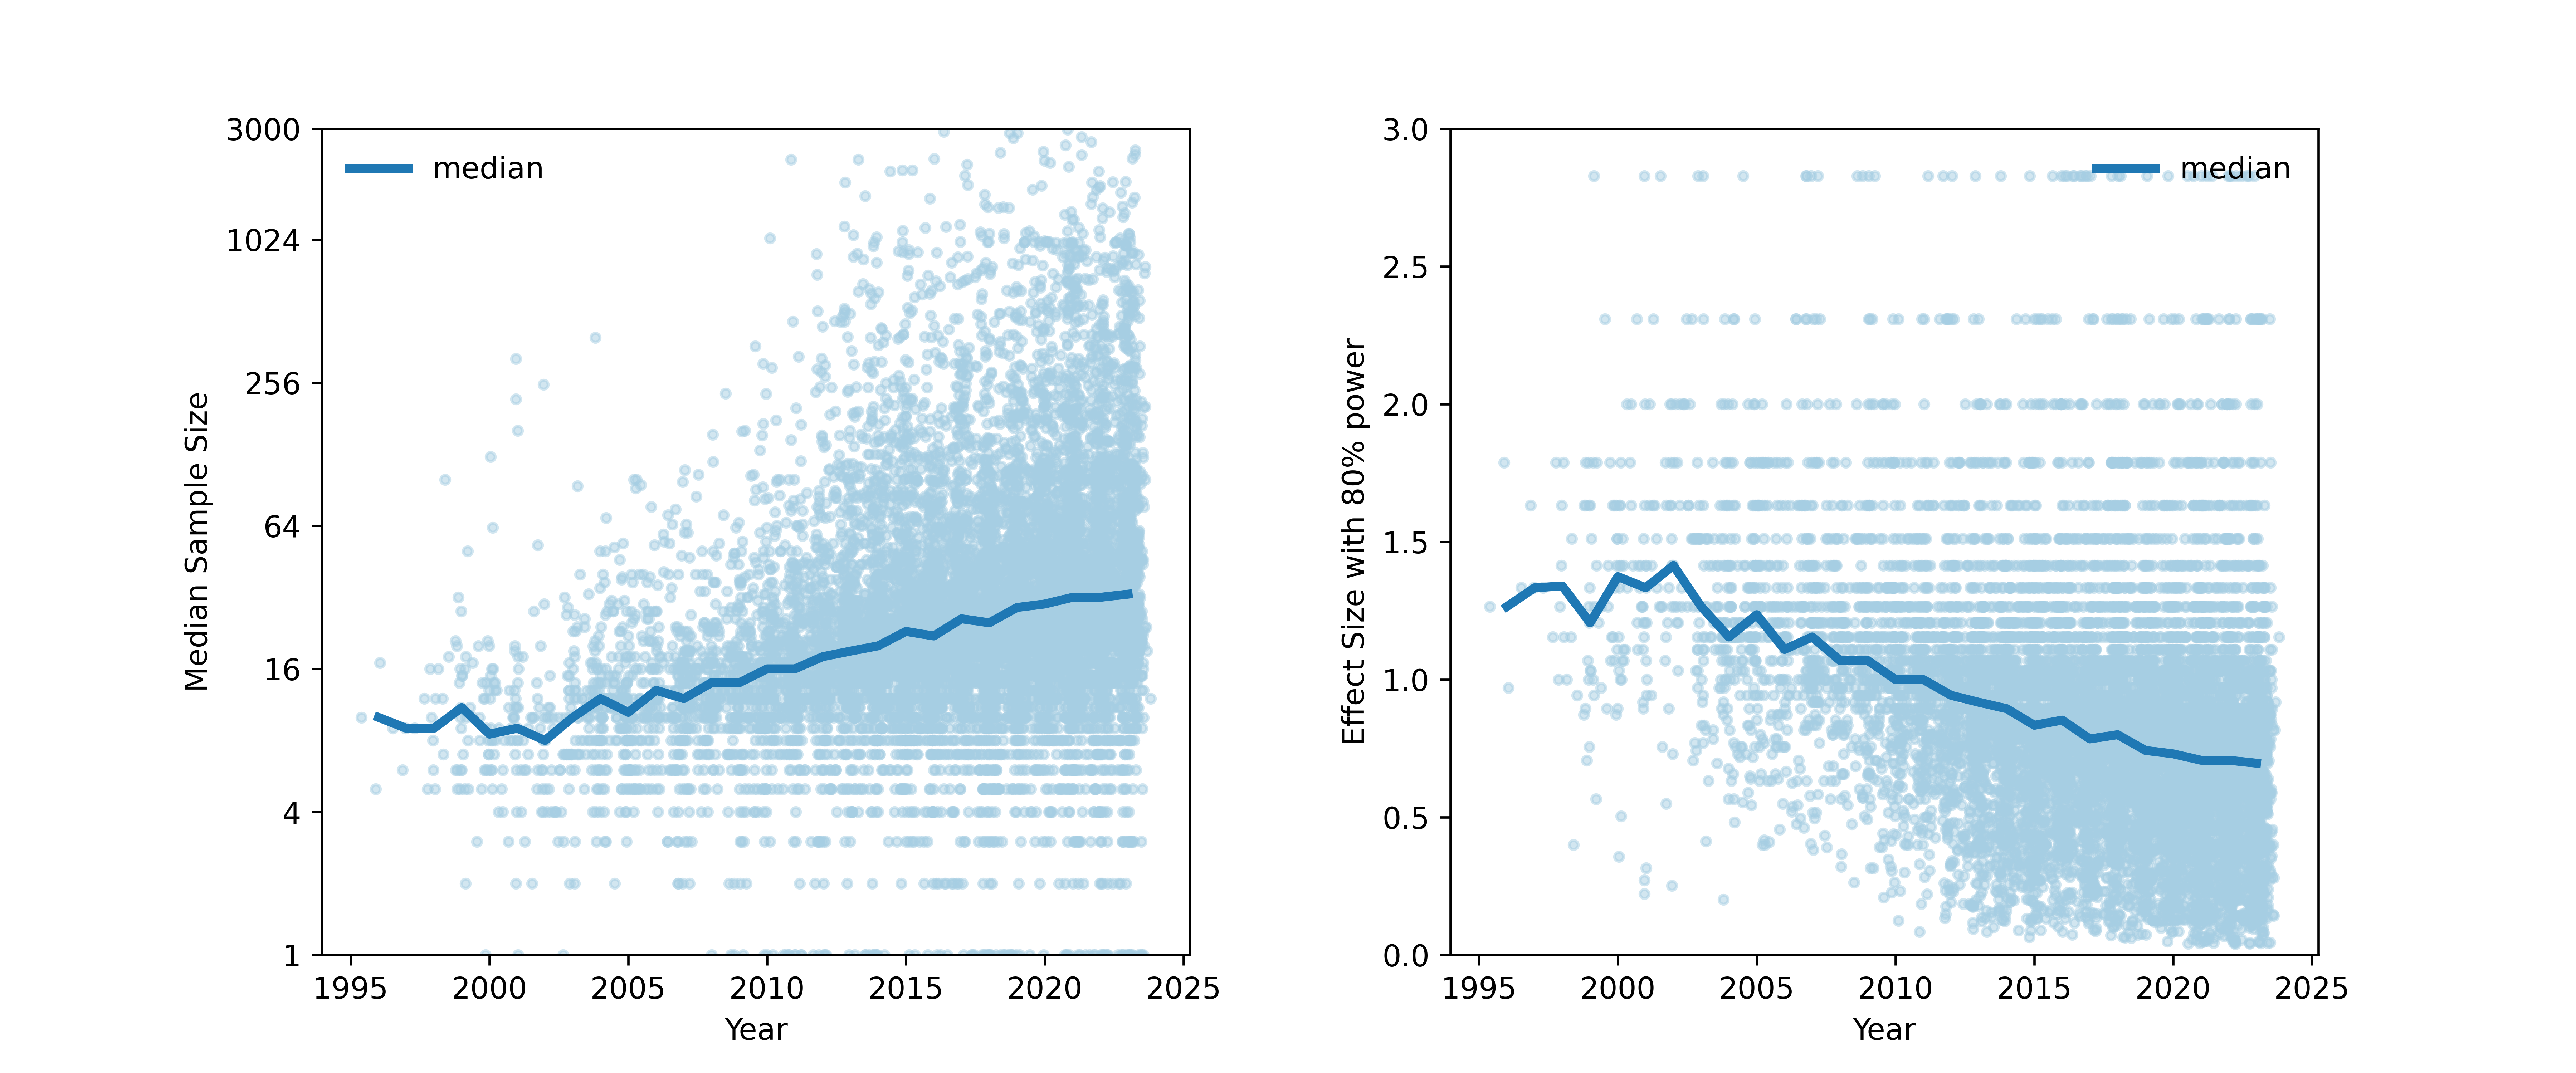
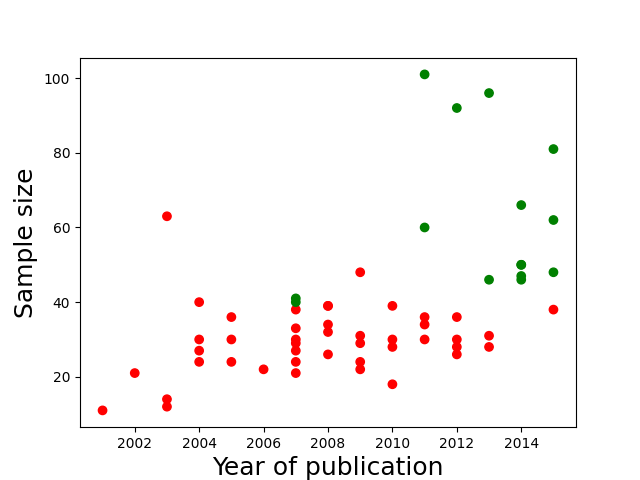
- Median study in 2024 (n=36/group) was powered to find a single 200 voxel activation with d~0.67
- Is that plausible?
Updated from Poldrack et al., 2017
Estimating realistic effect sizes
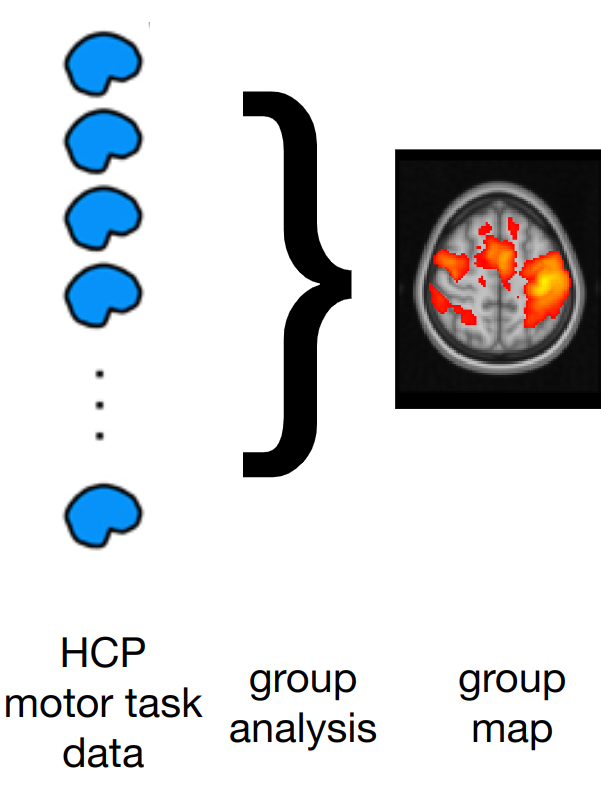
Estimating realistic effect sizes

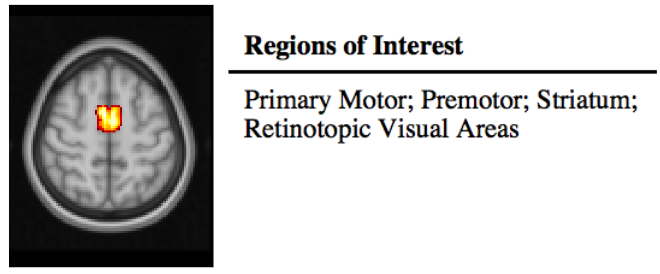
Estimating realistic effect sizes


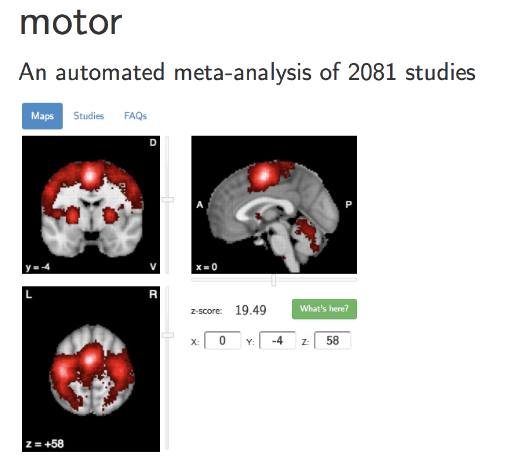
Estimating realistic effect sizes


Unbiased effect size estimate
What are realistic effect sizes for fMRI?
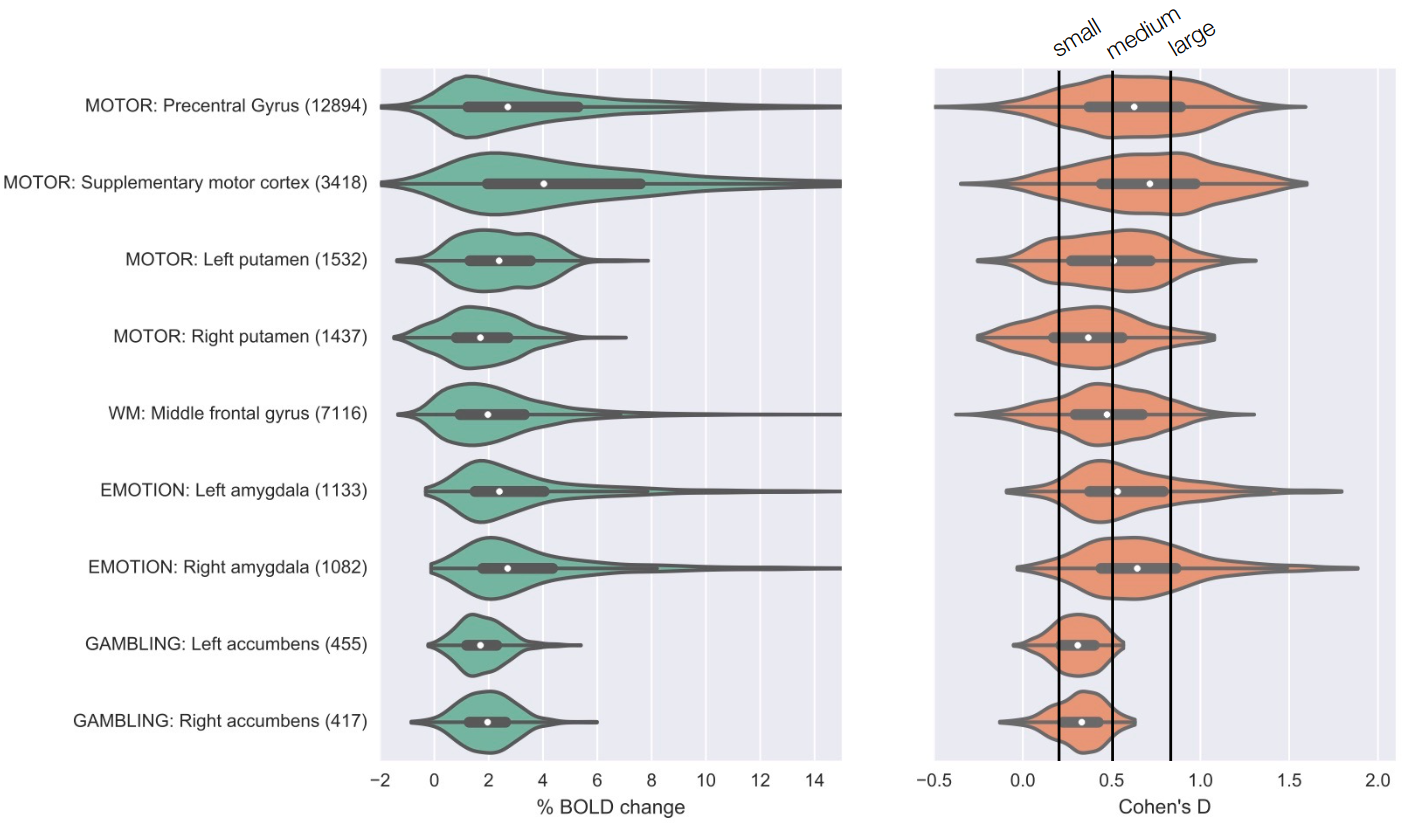
Poldrack et al., 2017, Nature Reviews Neuroscience
Depression studies from Muller et al.
Authors must collect at last 20 observations per cell or else provide a compelling cost-of-data-collection justification. This requirement offers extra protection for the first requirement. Samples smaller than 20 per cell are simply not powerful enough to detect most effects, and so there is usually no good reason to decide in advance to collect such a small number of observations. Smaller samples, it follows, are much more likely to reflect interim data analysis and a flexible termination rule (Simmons et al., 2011)
Small samples -> variable estimates of predictive accuracy
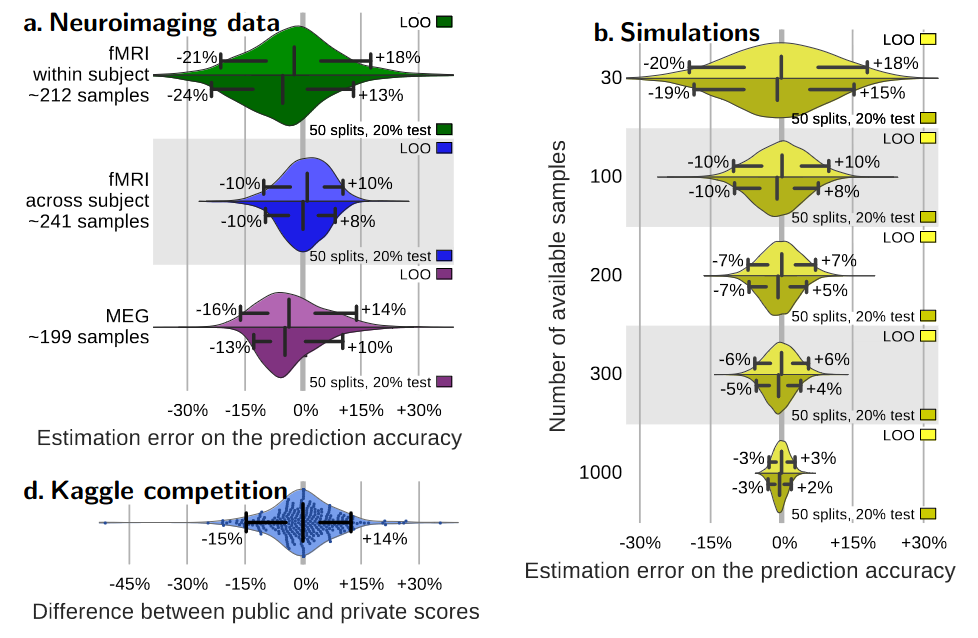
Varoquaux, 2018
Small samples + publication bias -> inflated accuracy estimates
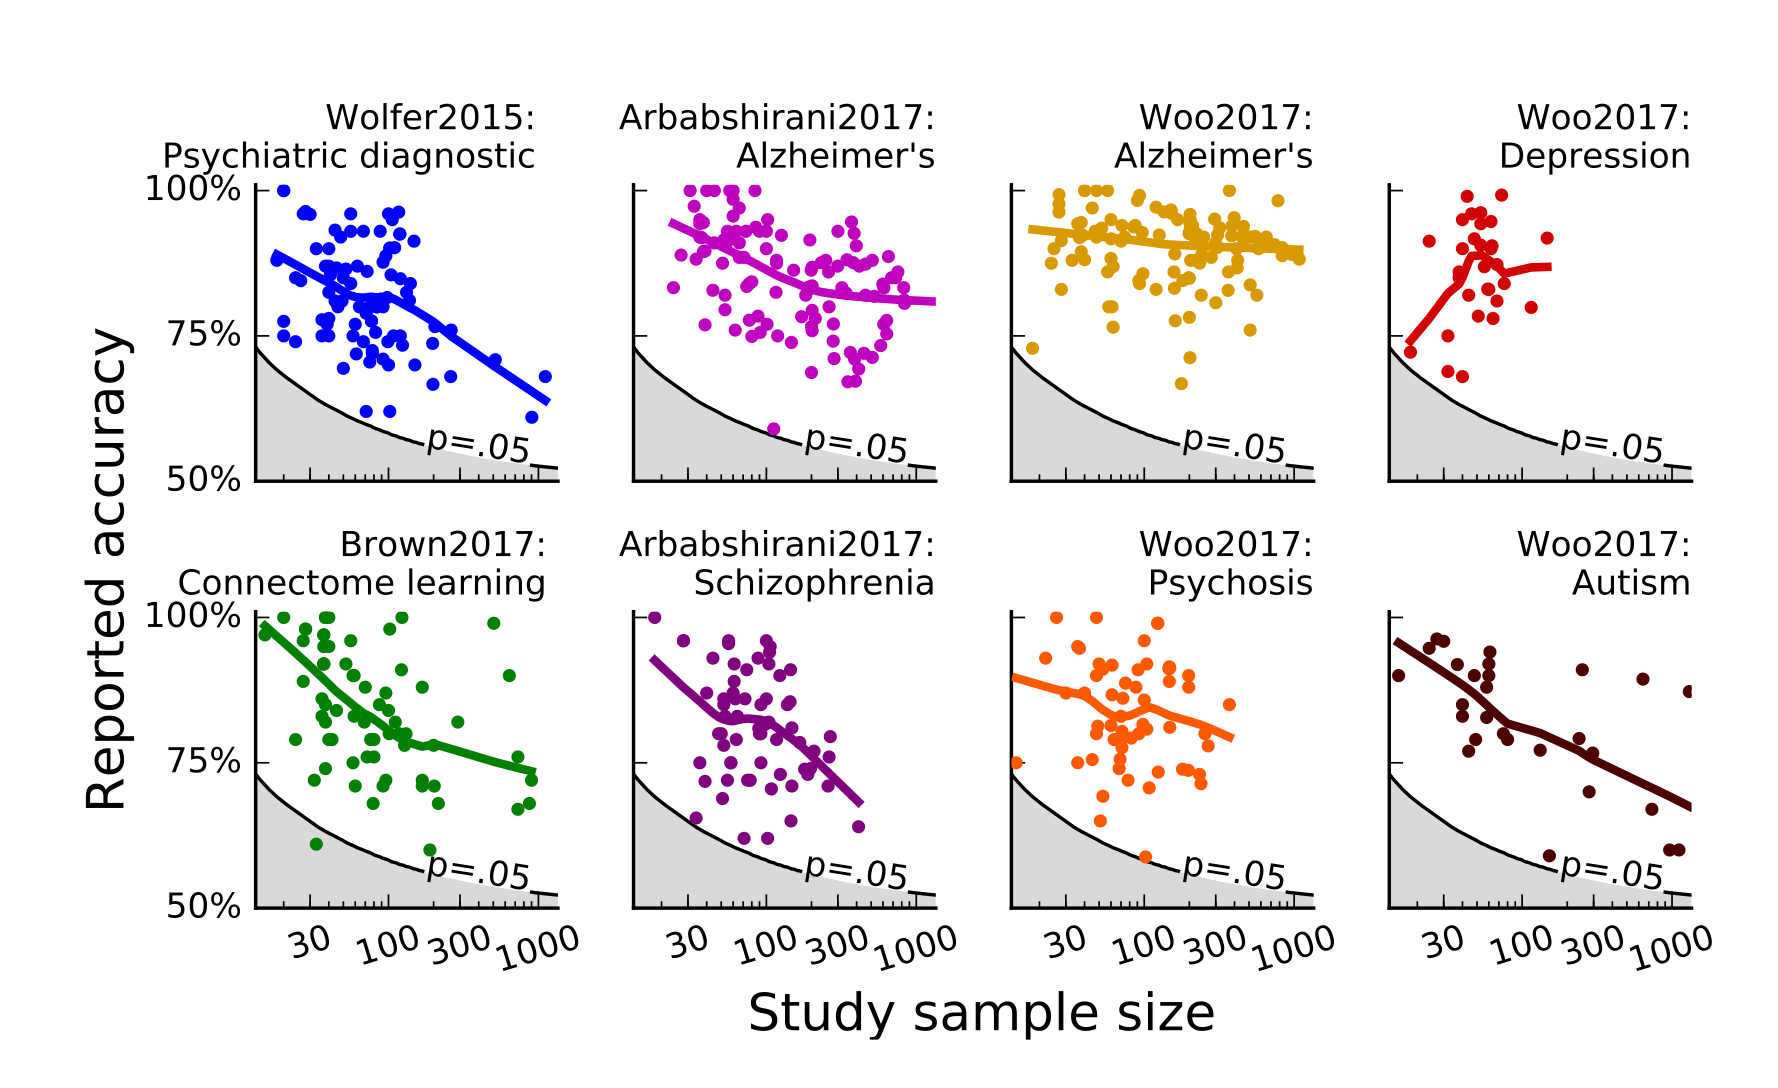
Varoquaux, 2018
Doing well-powered science as a trainee

- Underpowered science is futile, but many ECRs don’t have resources to do sufficiently powered studies
- “if you can’t answer the question you love, love the question you can” (Kanwisher, 2017)
- Pivots:
- Collaborate
- Use shared data
- Focus on theory/computational modeling
A golden age of data sharing


- The greater the flexibility in designs, definitions, outcomes, and analytical modes in a scientific field, the less likely the research findings are to be true.
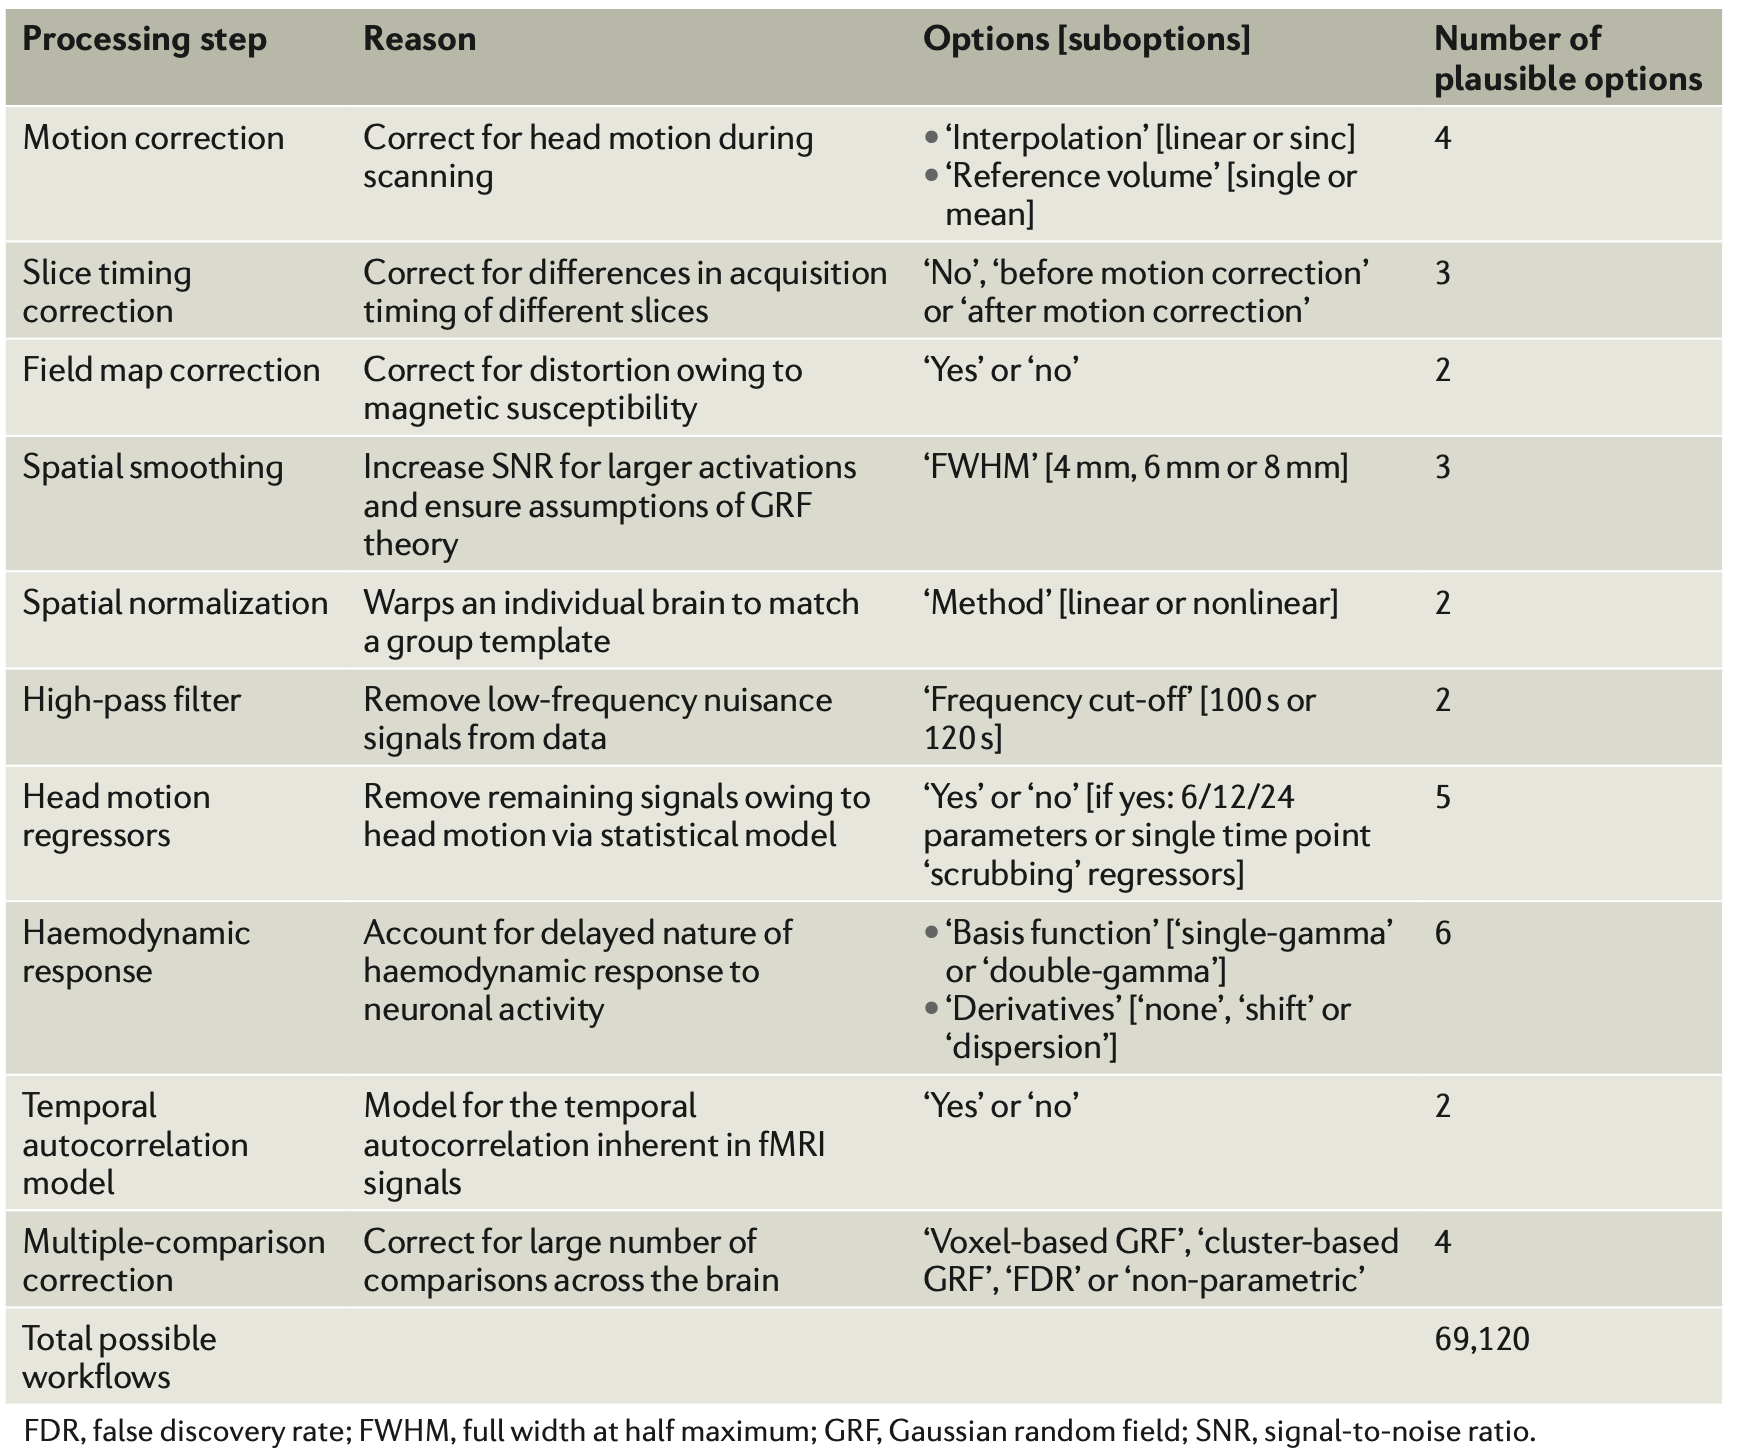
Poldrack et al., 2017


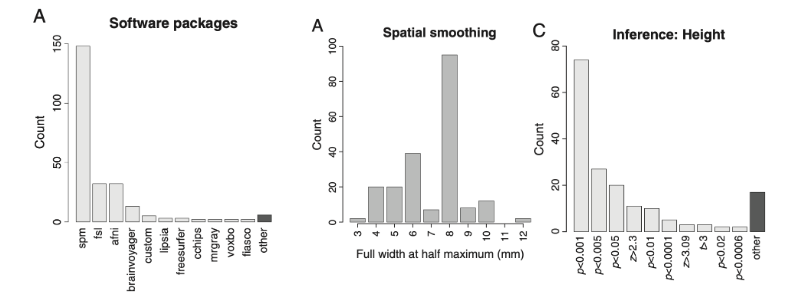
“data collection and analysis methods were highly flexible across studies, with nearly as many unique analysis pipelines as there were studies in the sample [241].”

Machine learning can make it worse

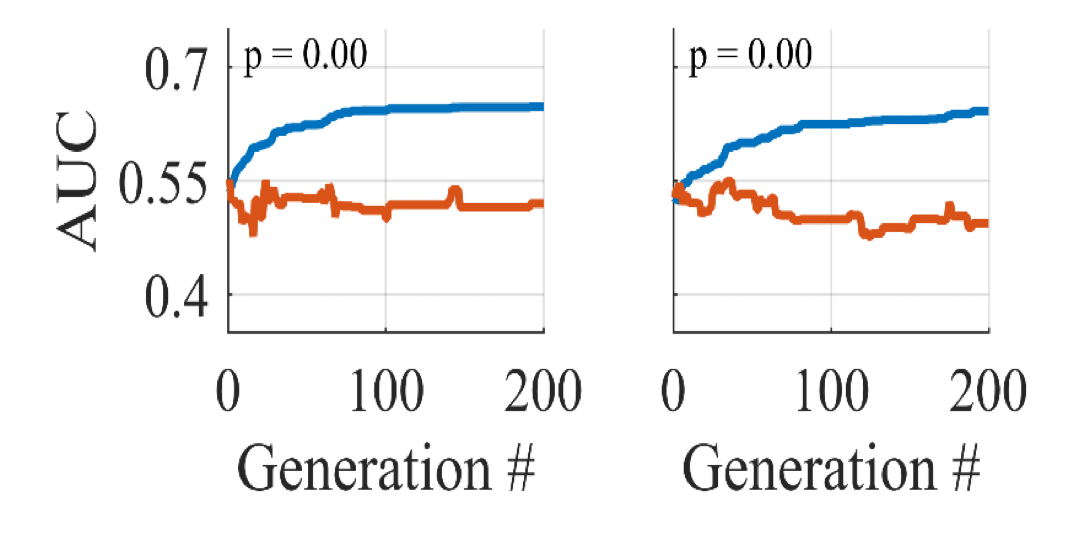
“In this article, we use Support Vector Machine (SVM) classifiers, and genetic algorithms to demonstrate the ease by which overfitting can occur, despite the use of cross validation. We demonstrate that comparable and non-generalizable results can be obtained on informative and non-informative (i.e. random) data by iteratively modifying hyperparameters in seemingly innocuous ways.”
It’s not just fMRI


The purpose of this paper is to demonstrate how common and seemingly innocuous methods for quantifying and analyzing ERP effects can lead to very high rates of significant but bogus effects, with the likelihood of obtaining at least one such bogus effect exceeding 50% in many experiments.
Improving reproducibility through pre-registration
- Register analysis plan prior to accessing data
- Preferably with code based on analysis of simulated data
- This does not prevent exploratory analysis
- But planned and exploratory analyses should be clearly delineated in the paper
- If the preregistration commits you to something that you learn is bad, you can always deviate
- as long as you are explicit in the paper
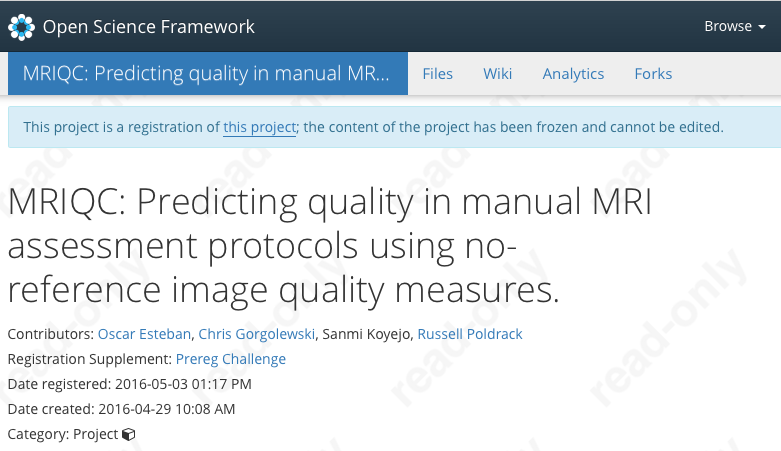
http://www.russpoldrack.org/2016/09/why-preregistration-no-longer-makes-me.html
- The requirement for clinical trial registration was associated with many more null effects
- This is a “cost” under the current incentives to publish
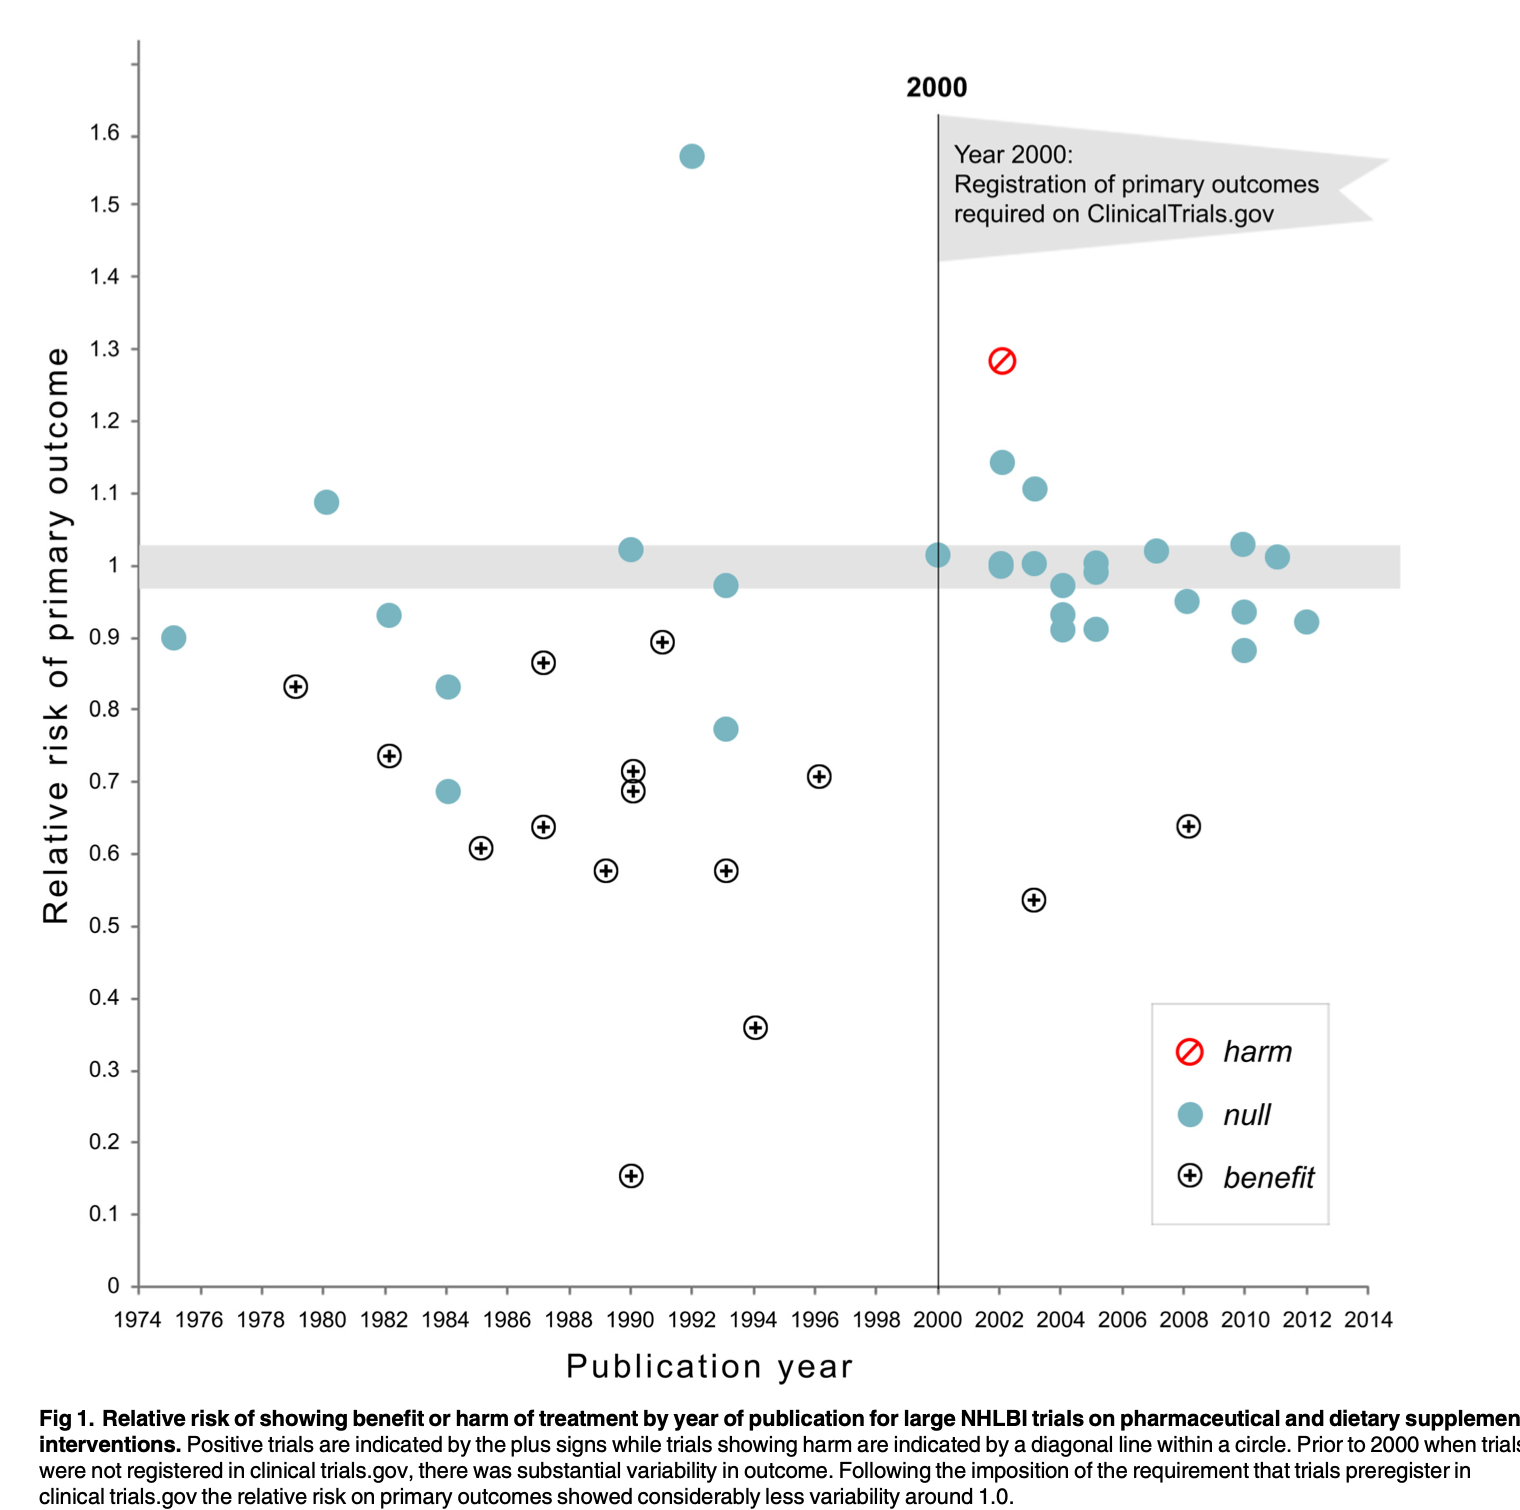
Kaplan & Irvin, 2015
Pre-registering neuroimaging studies is hard!
- Specify as much as possible
- How will sample size be determined?
- Inclusion/exclusion criteria
- Primary hypotheses to be tested
- Anatomical regions of interest
- Analysis plan
- Preferably with code tested on existing or simulated data
https://prereg-psych.org/create/
Pre-registration prevents p-hacking but does not eliminate analytic variability
How variable are neuroimaging analysis workflows in the wild?
What is the effect on scientific inferences?
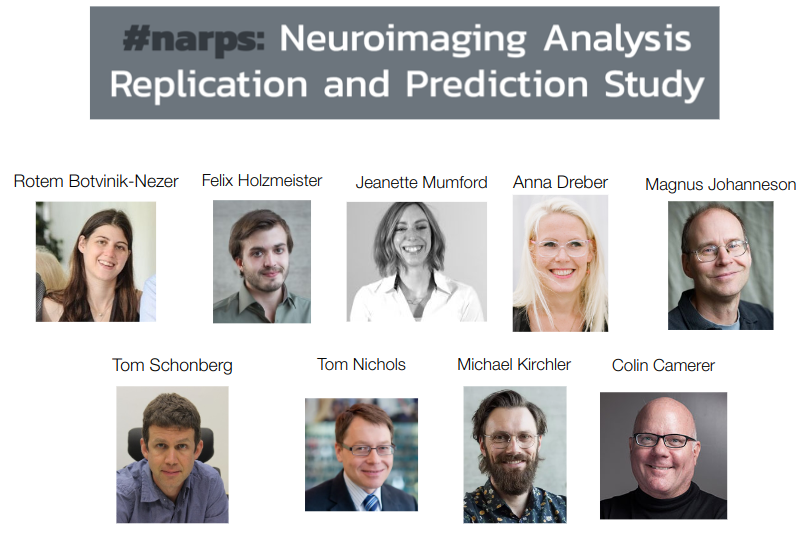
Botvinik-Nezer et al., 2020, Nature
Data collection: Mixed gambles task
- Functional MRI data for 108 subjects collected at Tel Aviv University
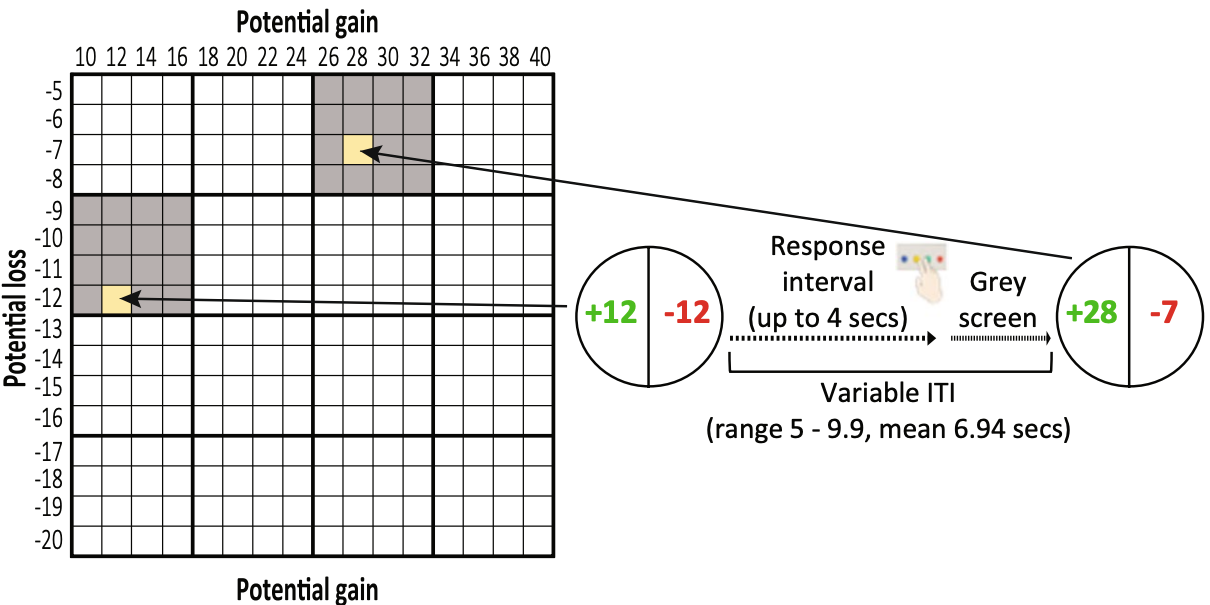
Botvinik-Nezer et al., 2020, Nature
Study recruitment
- Analysis teams recruited via social media and conferences
- Up to 3 people each
- Signed non-disclosure agreement
- Offered co-authorship on initial paper
- Raw dataset (~400GB) distributed to 82 teams via Globus
- Teams given ~3 months to provide Y/N answers to 9 hypothesis tests:
- Is there significant activation in
for ?
- Is there significant activation in
- Using their standard analysis workflow
- Only restriction was that analysis should include whole brain
Botvinik-Nezer et al., 2020, Nature
Results collection
- Received final results from 70 teams
- Teams reported their yes/no decisions for each hypothesis
- Also uploaded the whole-brain statistical maps before and after thresholding
Botvinik-Nezer et al., 2020, Nature
How variable are workflows in the wild?

- Teams provided a detailed written description of analysis workflows
- No 2 teams used an identical workflow
- Even with detailed written description it was often impossible to tell exactly what was done!
Botvinik-Nezer et al., 2020, Nature
What is the effect of analytic variability on outcomes?
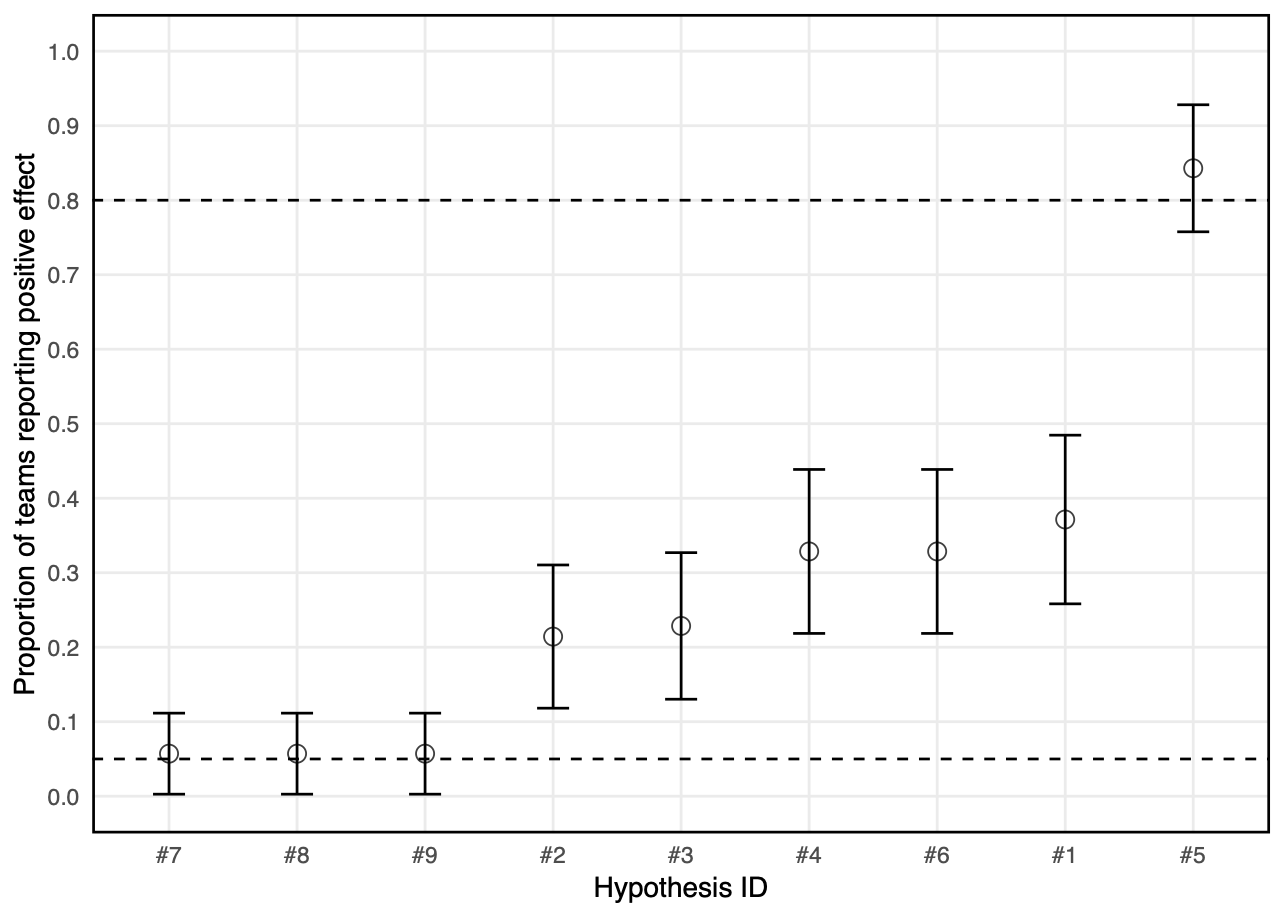
- Across teams there were 33 different patterns of outcomes
- For any hypothesis, there are at least 4 workflows that can give a positive result
Botvinik-Nezer et al., 2020, Nature
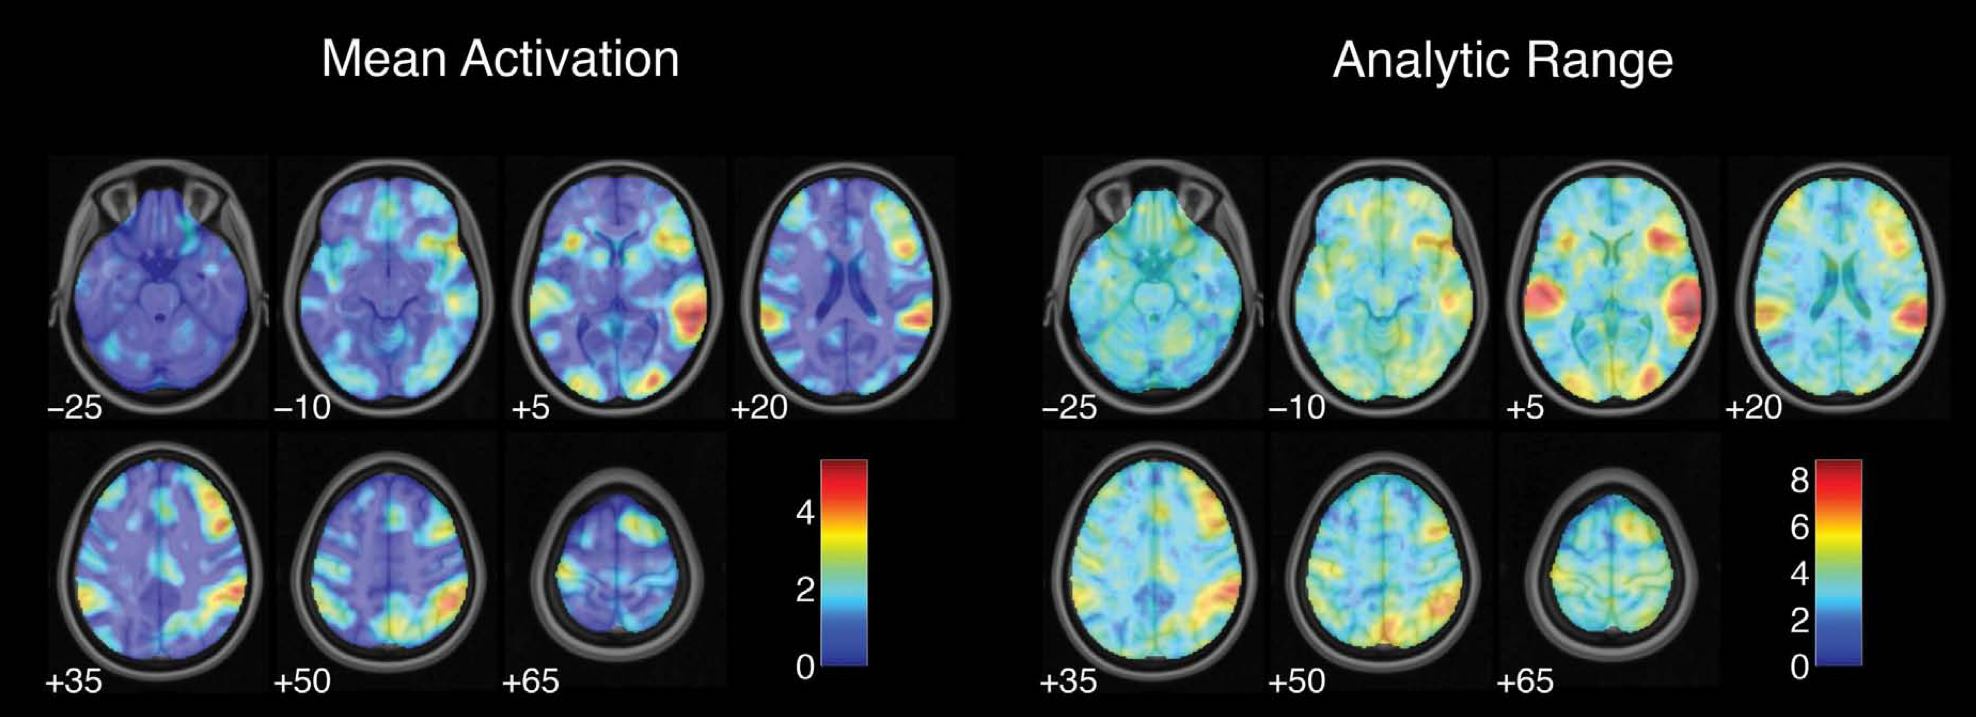
Variability of whole-brain results
Proportion of teams with activity in each voxel

Maximum overlap for all hypotheses: 76%
Botvinik-Nezer et al., 2020, Nature
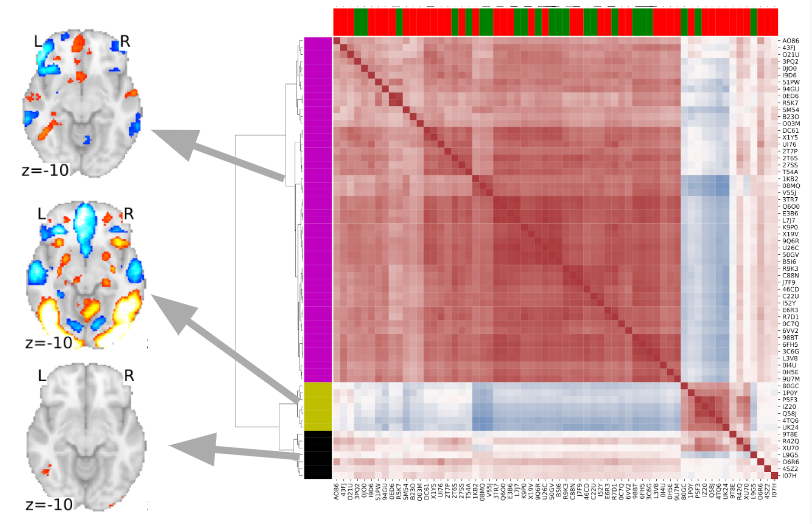
Botvinik-Nezer et al., 2020, Nature
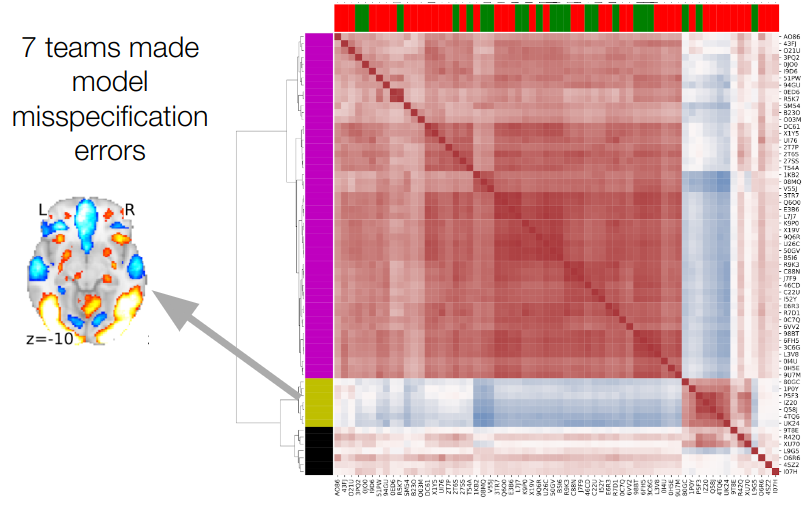
Botvinik-Nezer et al., 2020, Nature
Meta-analysis across groups shows reliable findings
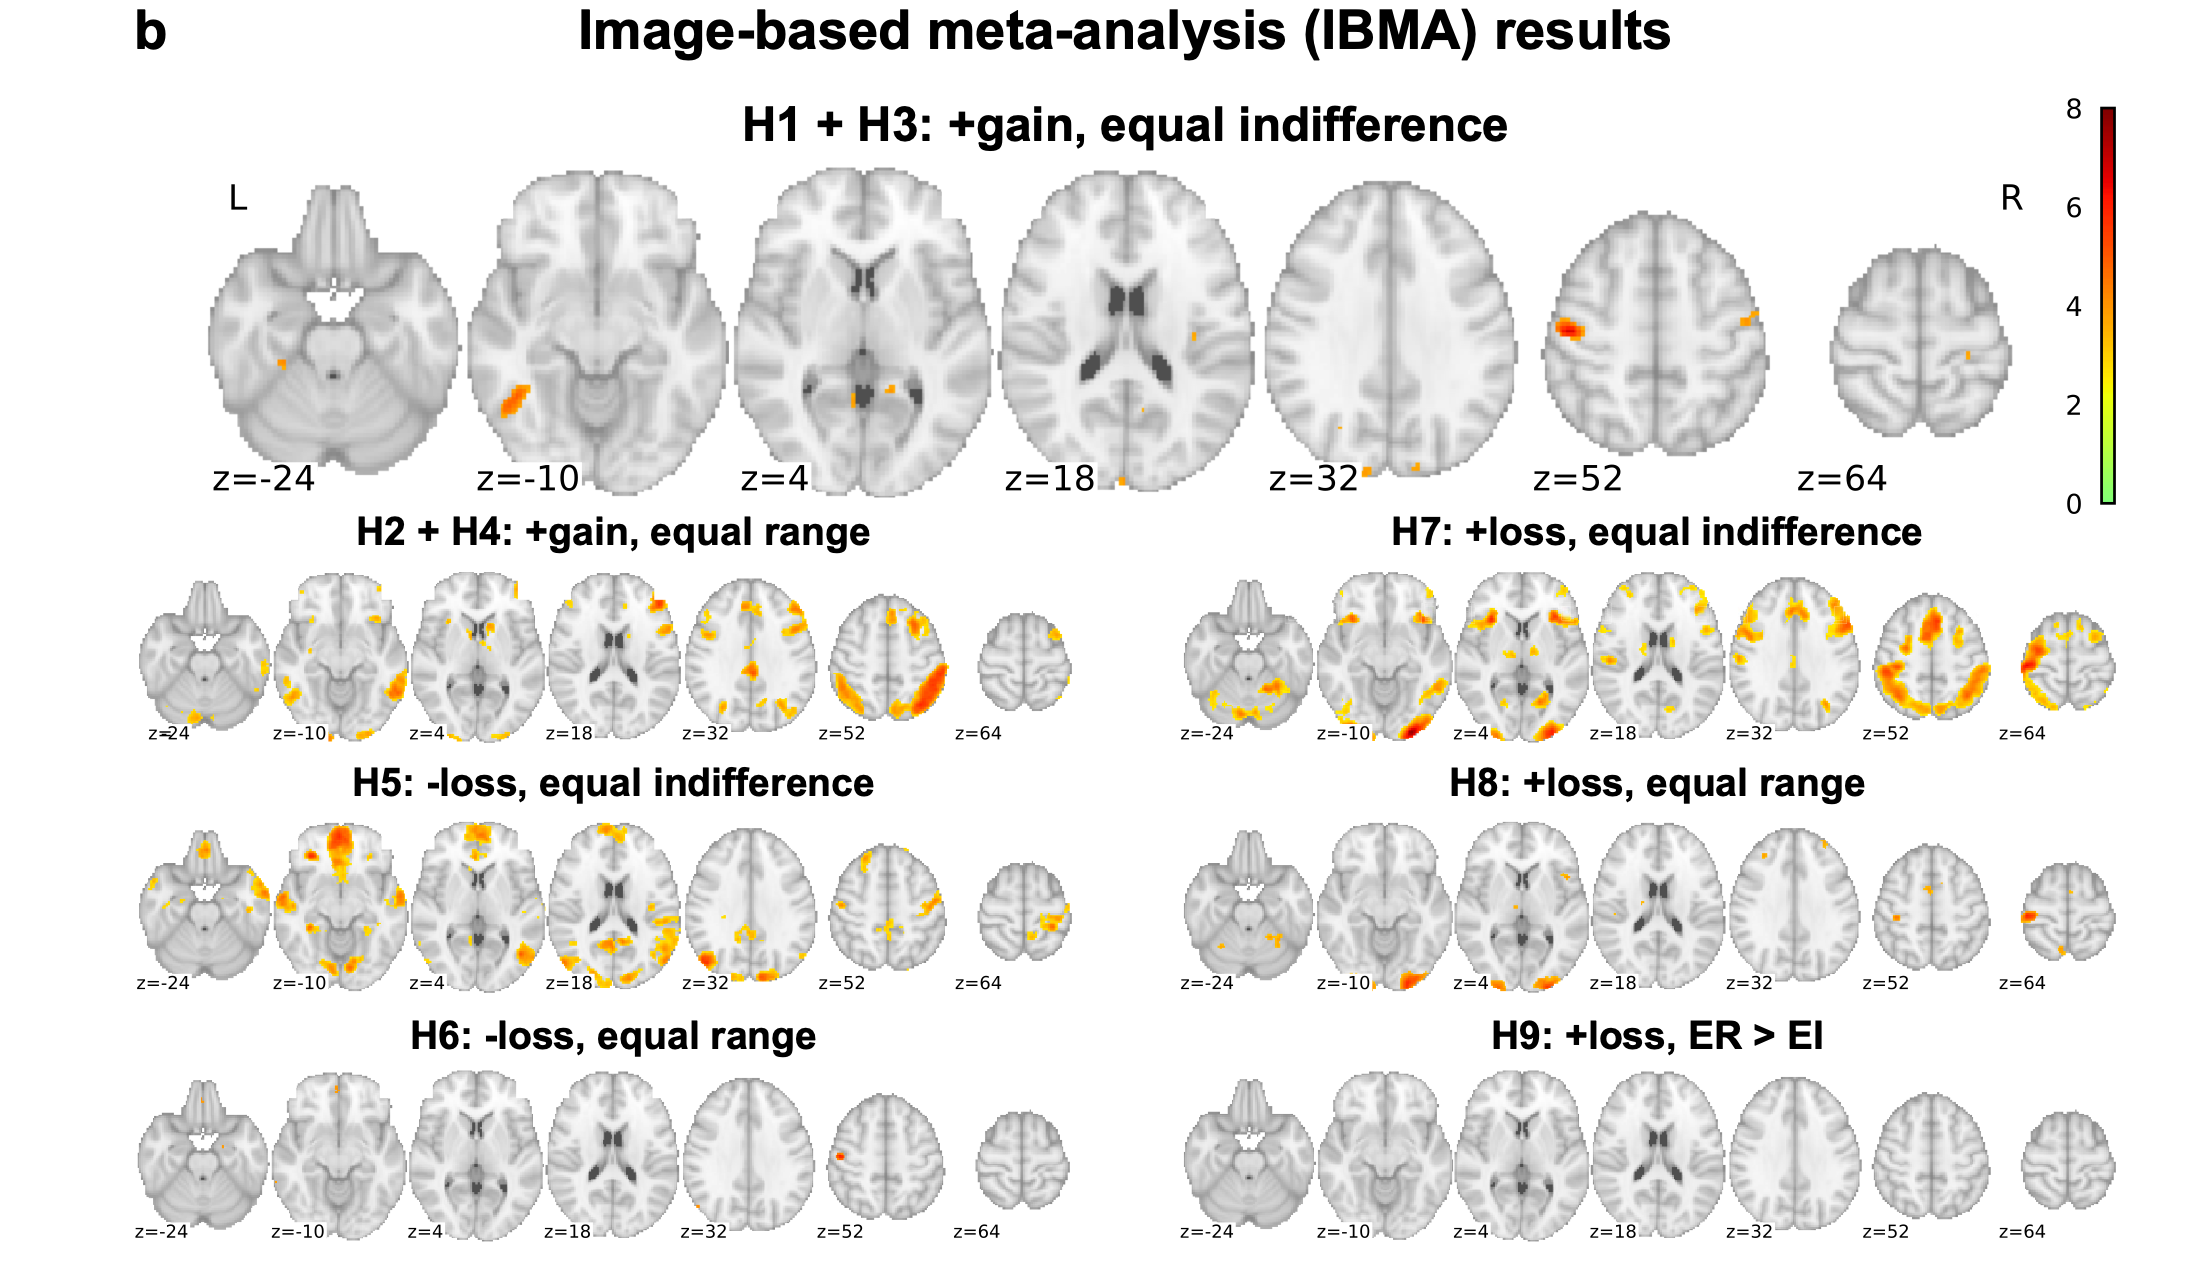
Botvinik-Nezer et al., 2020, Nature
How to improve analytic reproducibility
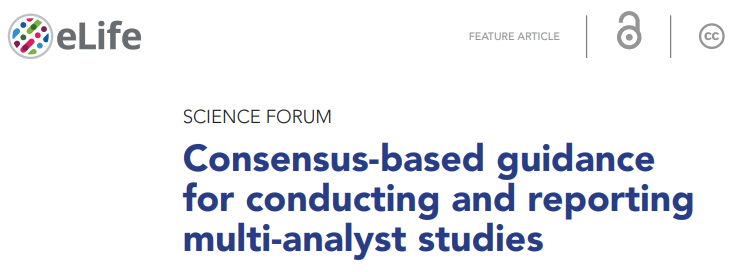
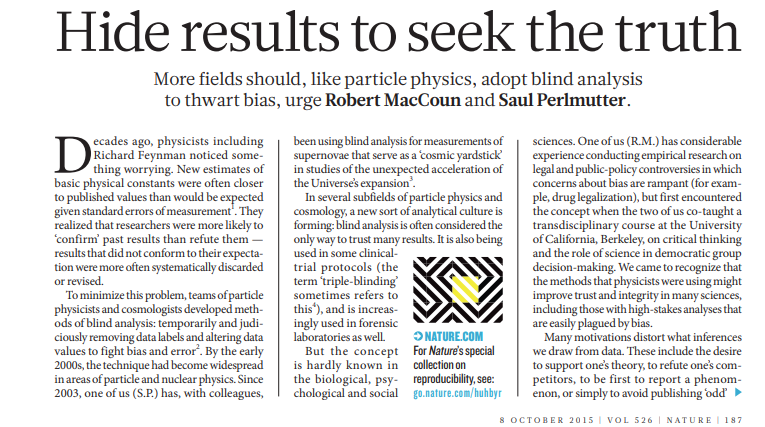
Multiverse analysis
- If the same dataset is analyzed in different ways, do we get the same answer?
- Previous work shows large effects of different analysis workflows
- “Vibration of effects” (Ioannidis)
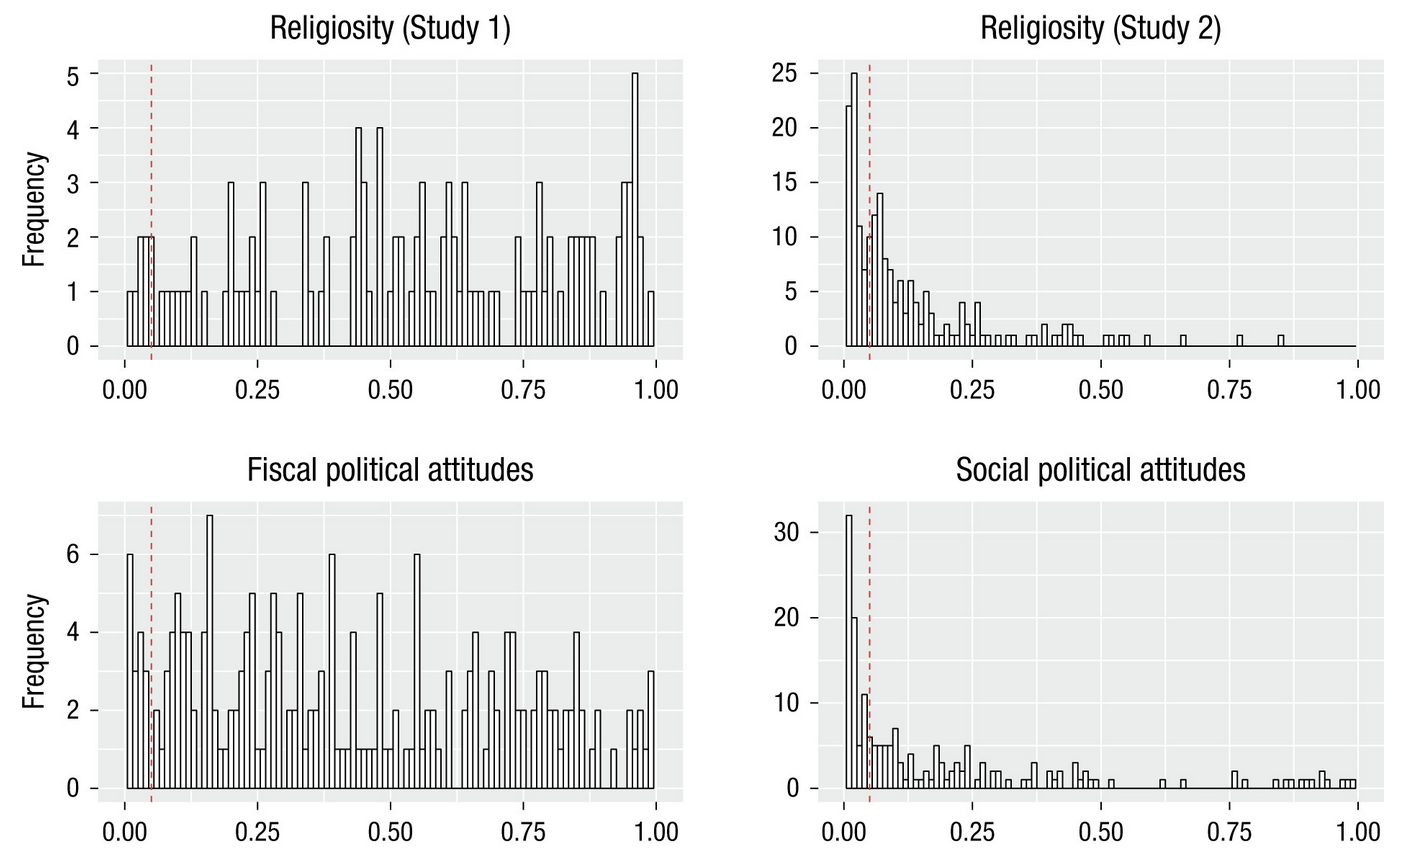
Steegen et al., 2016
A multiverse example: Are there analytic choices that consistently improve test-retest reliability?
- Test-retest reliability is essential for individual difference analyses
- Previous work has shown low but variable reliability
- How does this relate to analytic choices?
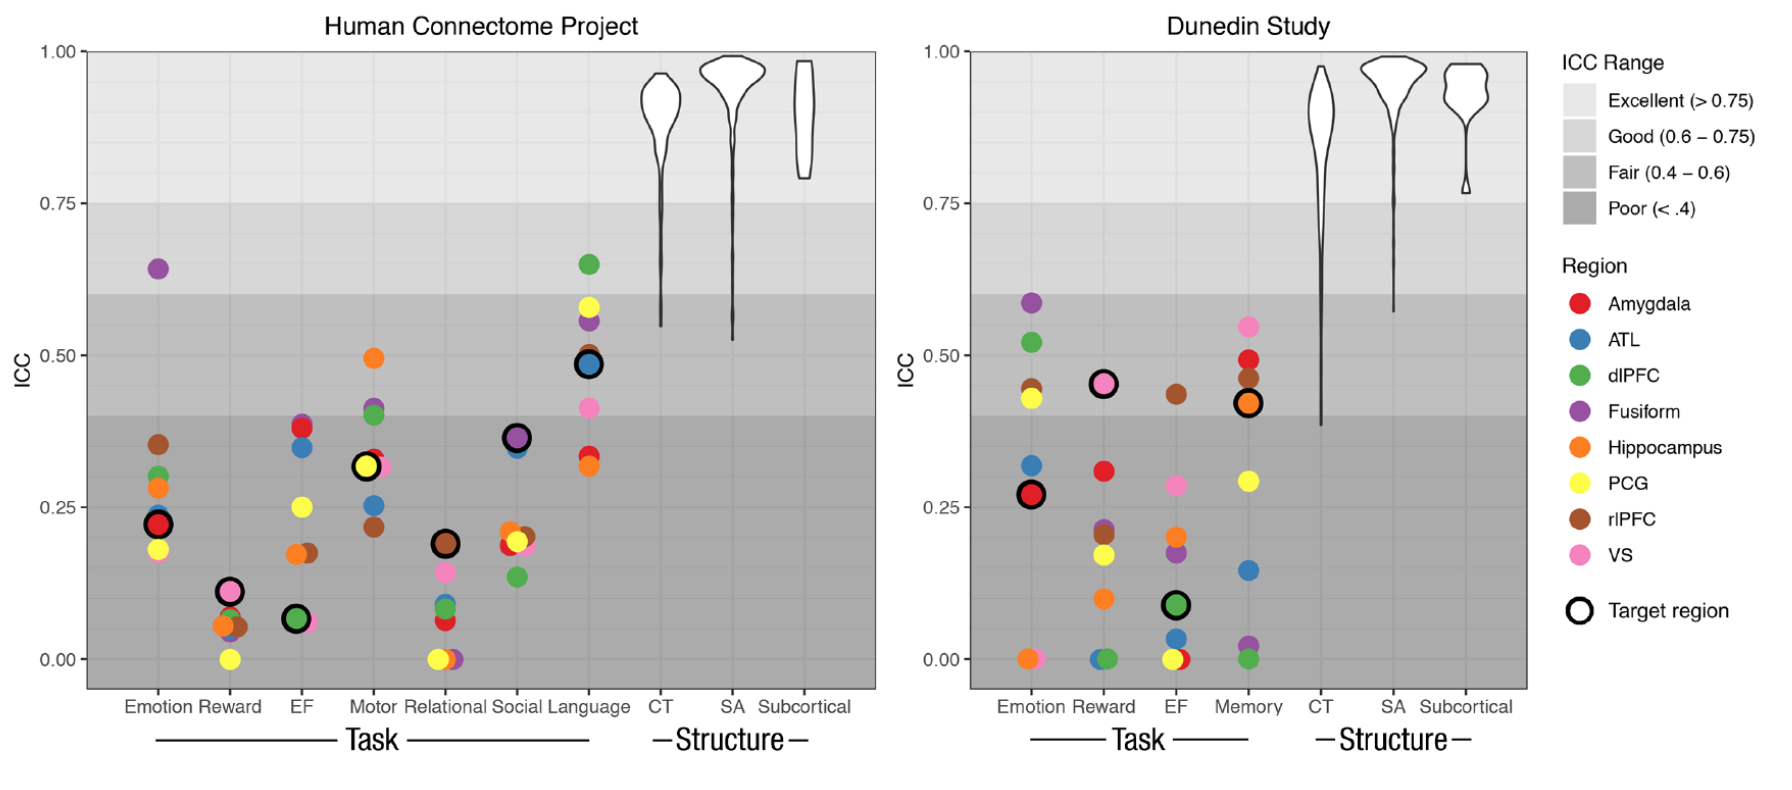
Elliott et al., 2020
Multiverse analysis of MID reliability
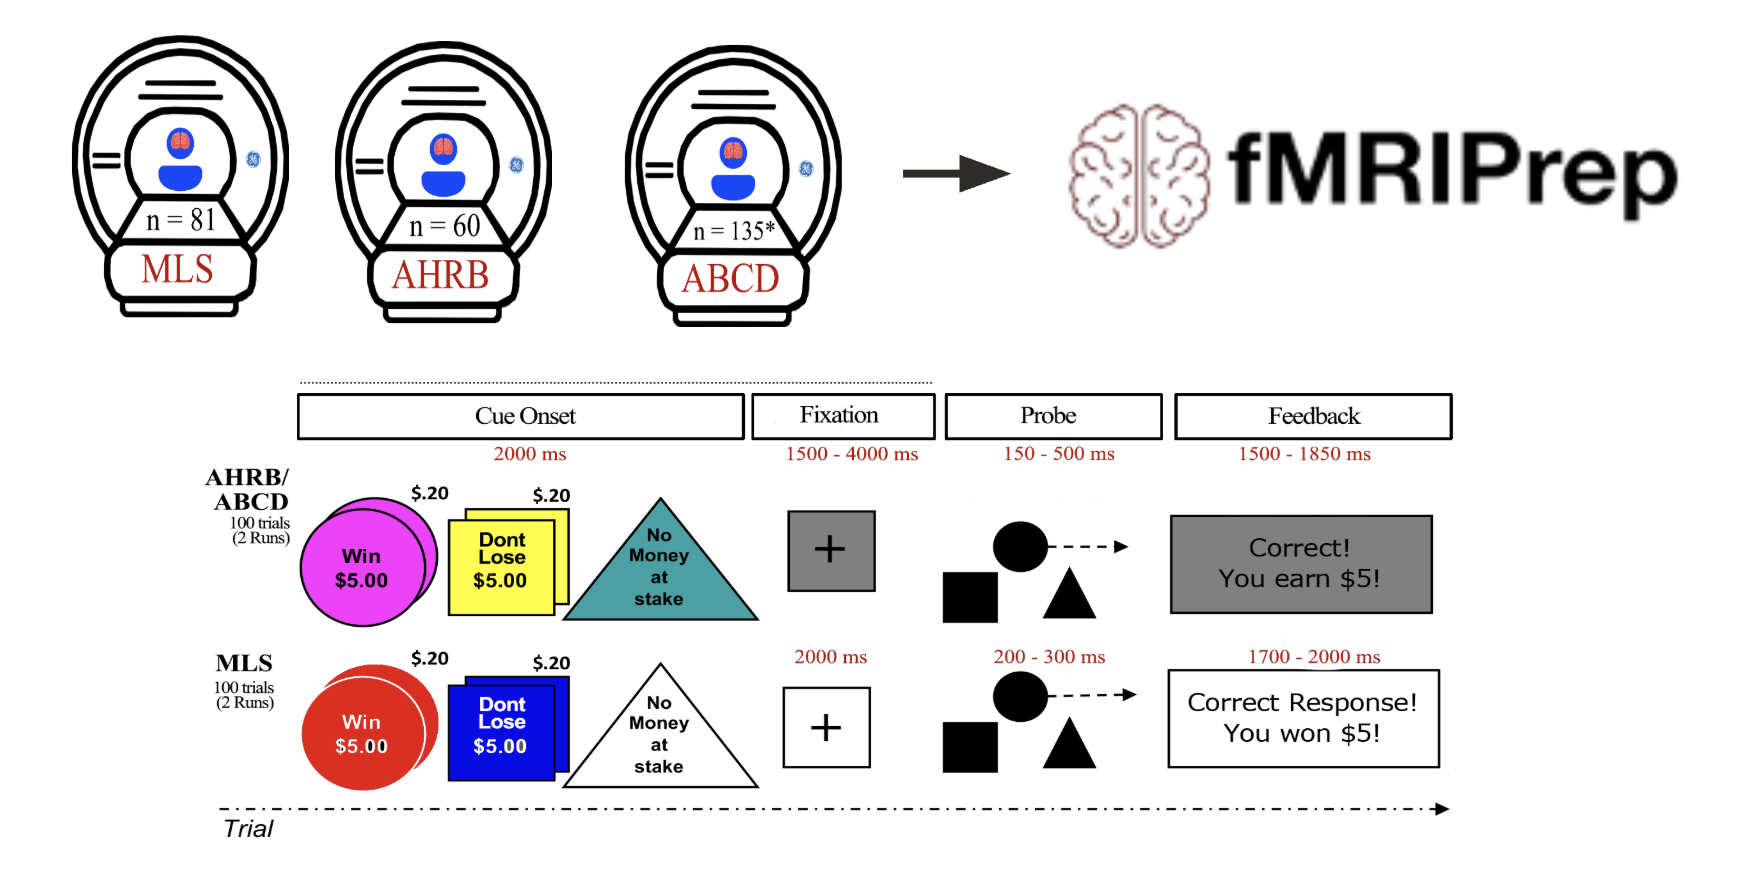
Demidenko et al., 2024
- Tested effects of several analytic choices over 240 pipelines
- Smoothing
- Motion modeling
- Model specification
- Contrast specification
- Overall, reliability was low
- But it varied substantially across models and contrasts
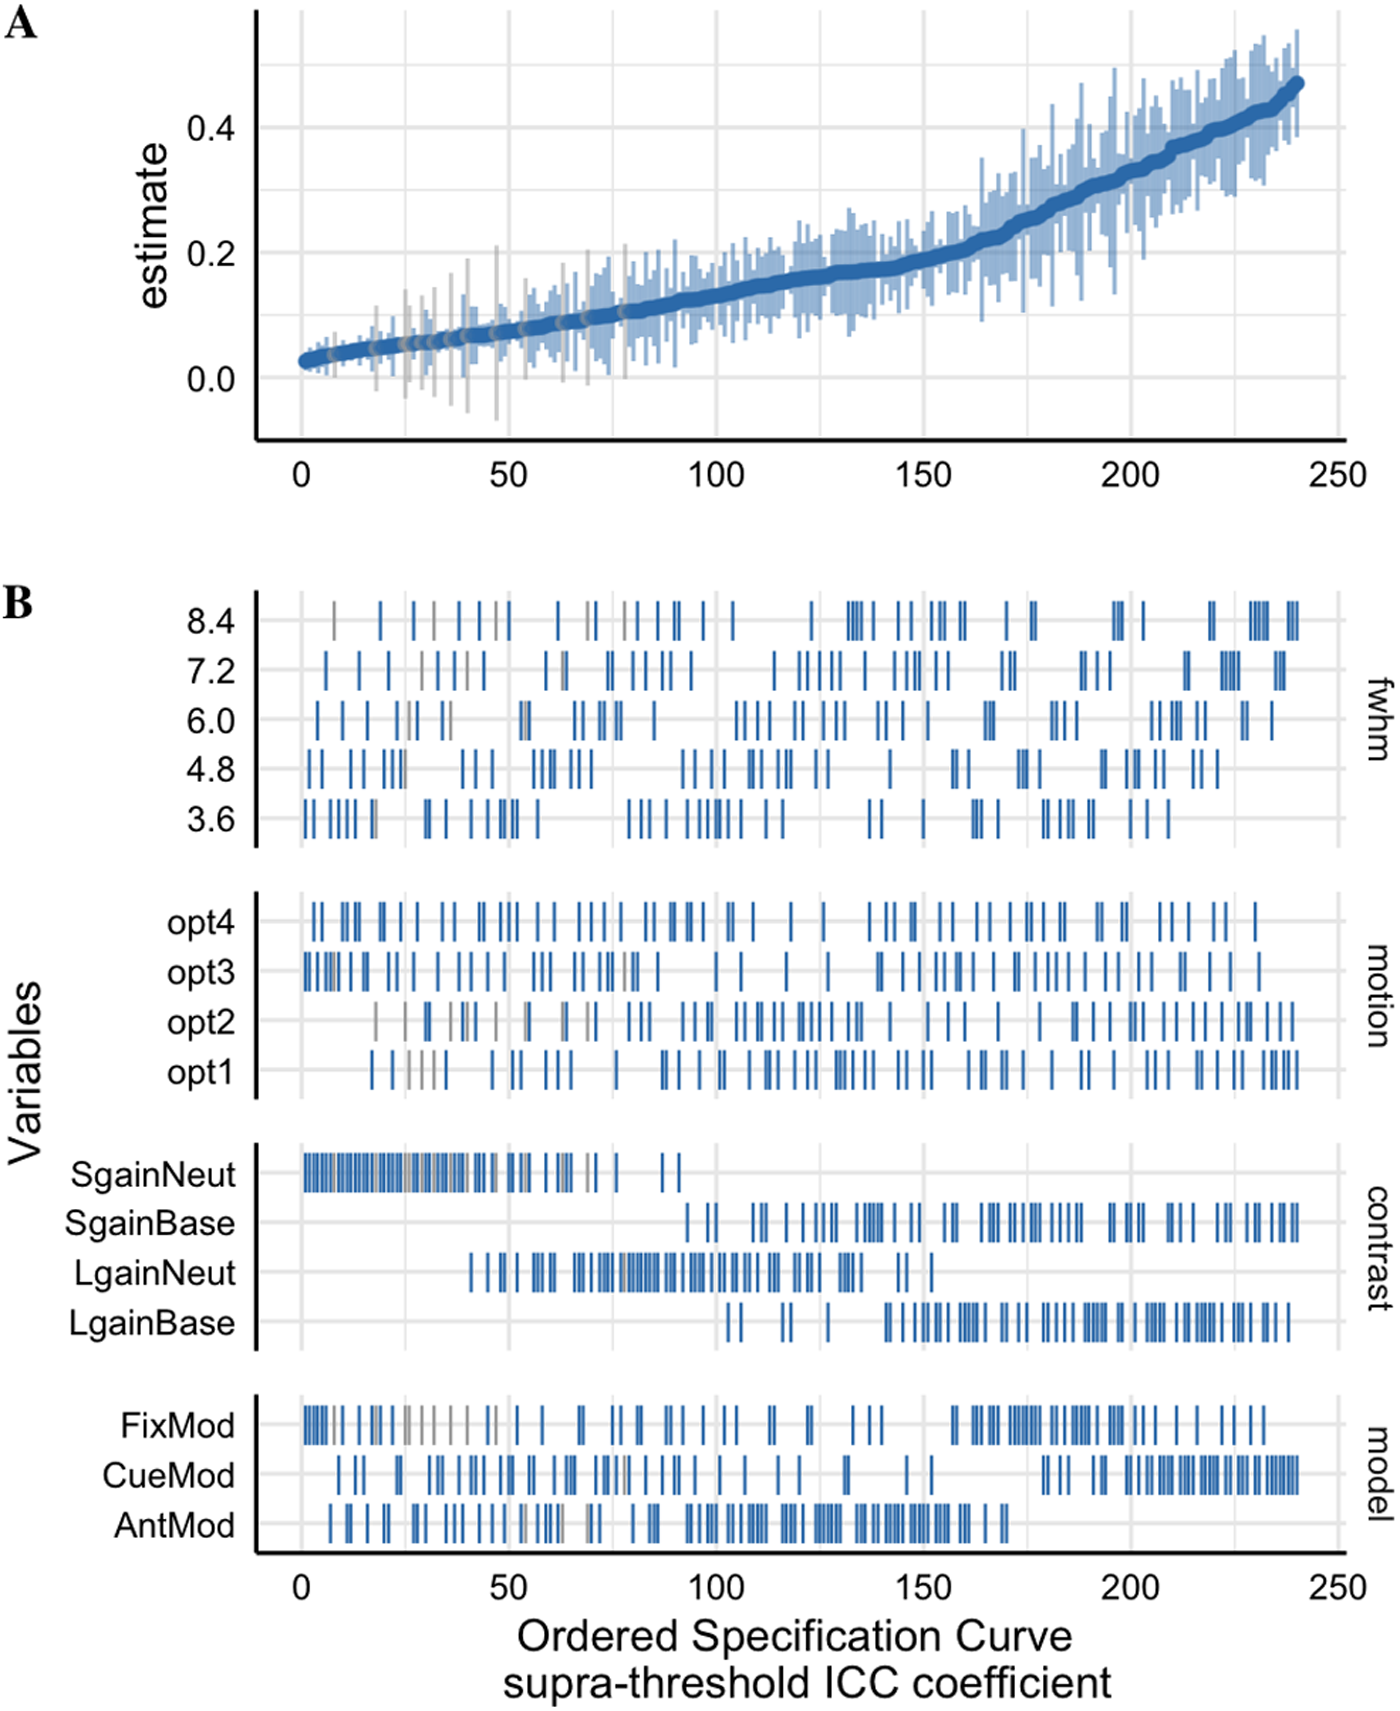
Demidenko et al., 2024
How many of you have written computer code in the course of your research?
How many of you have been trained in software engineering?
How many of you have ever written a test for your code?
Software errors are a threat to reproducibility

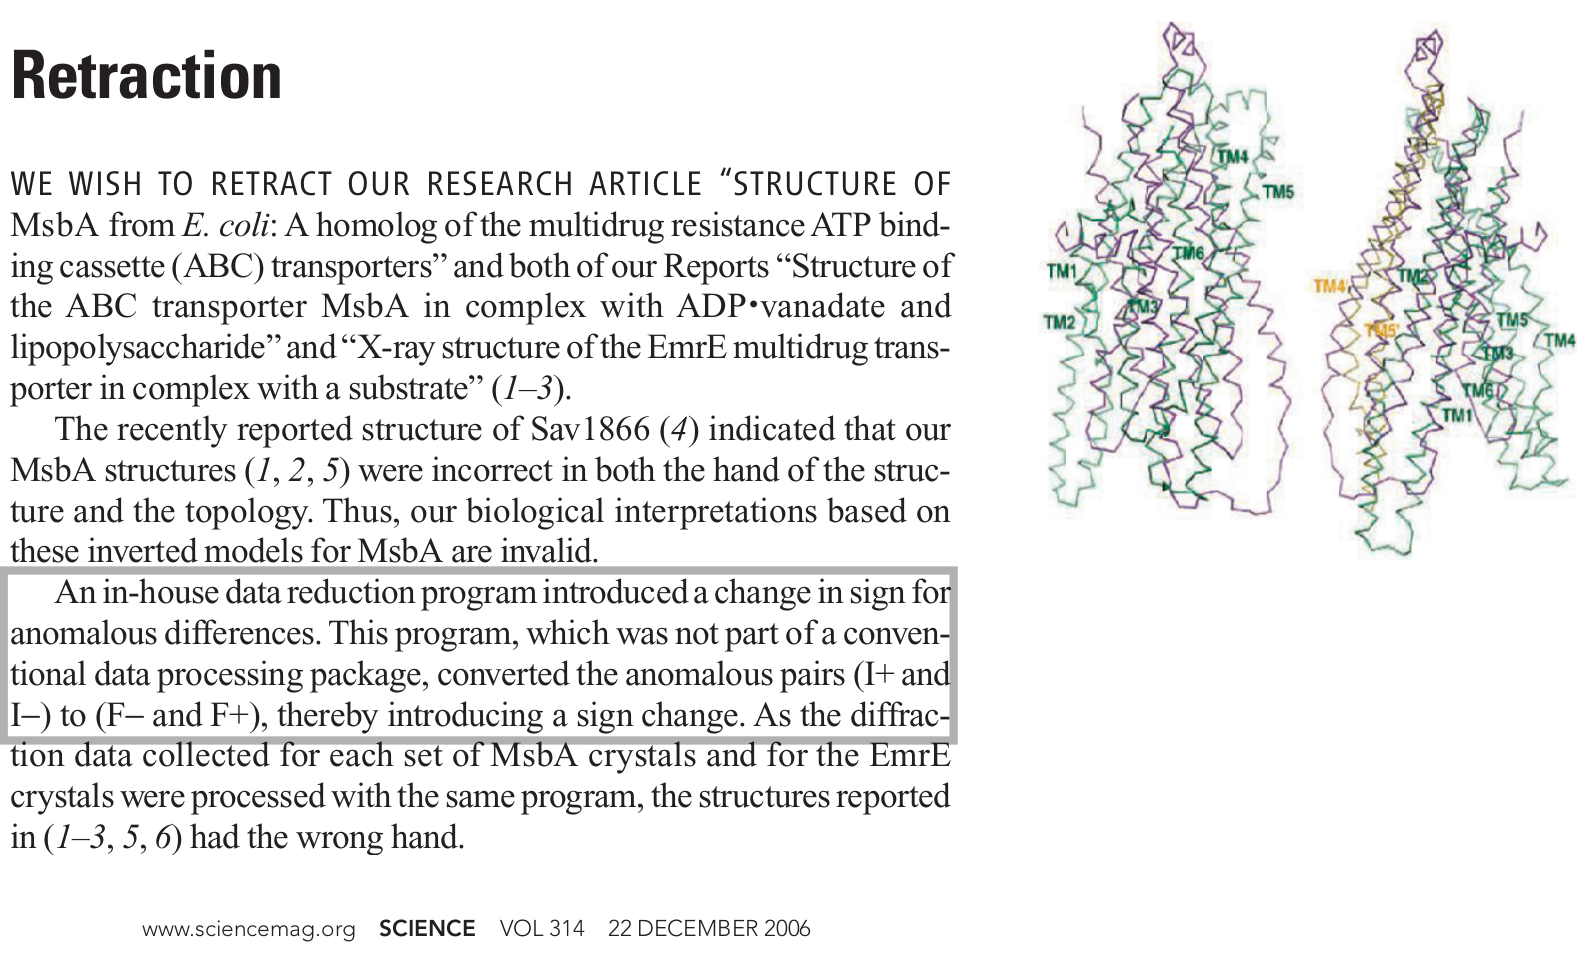
Small errors can have big effects
# 23-class classification problem

skf=StratifiedKFold(labels,8)

if trainsvm:
    pred=N.zeros(len(labels))
    for train,test in skf:
        clf=LinearSVC()
        clf.fit(data[train],labels[train])
        pred[test]=clf.predict(data[test])
Results: 93% accuracy
http://www.russpoldrack.org/2013/02/anatomy-of-coding-error.html
data[:,train]
data[:,test]
Results: 53% accuracy
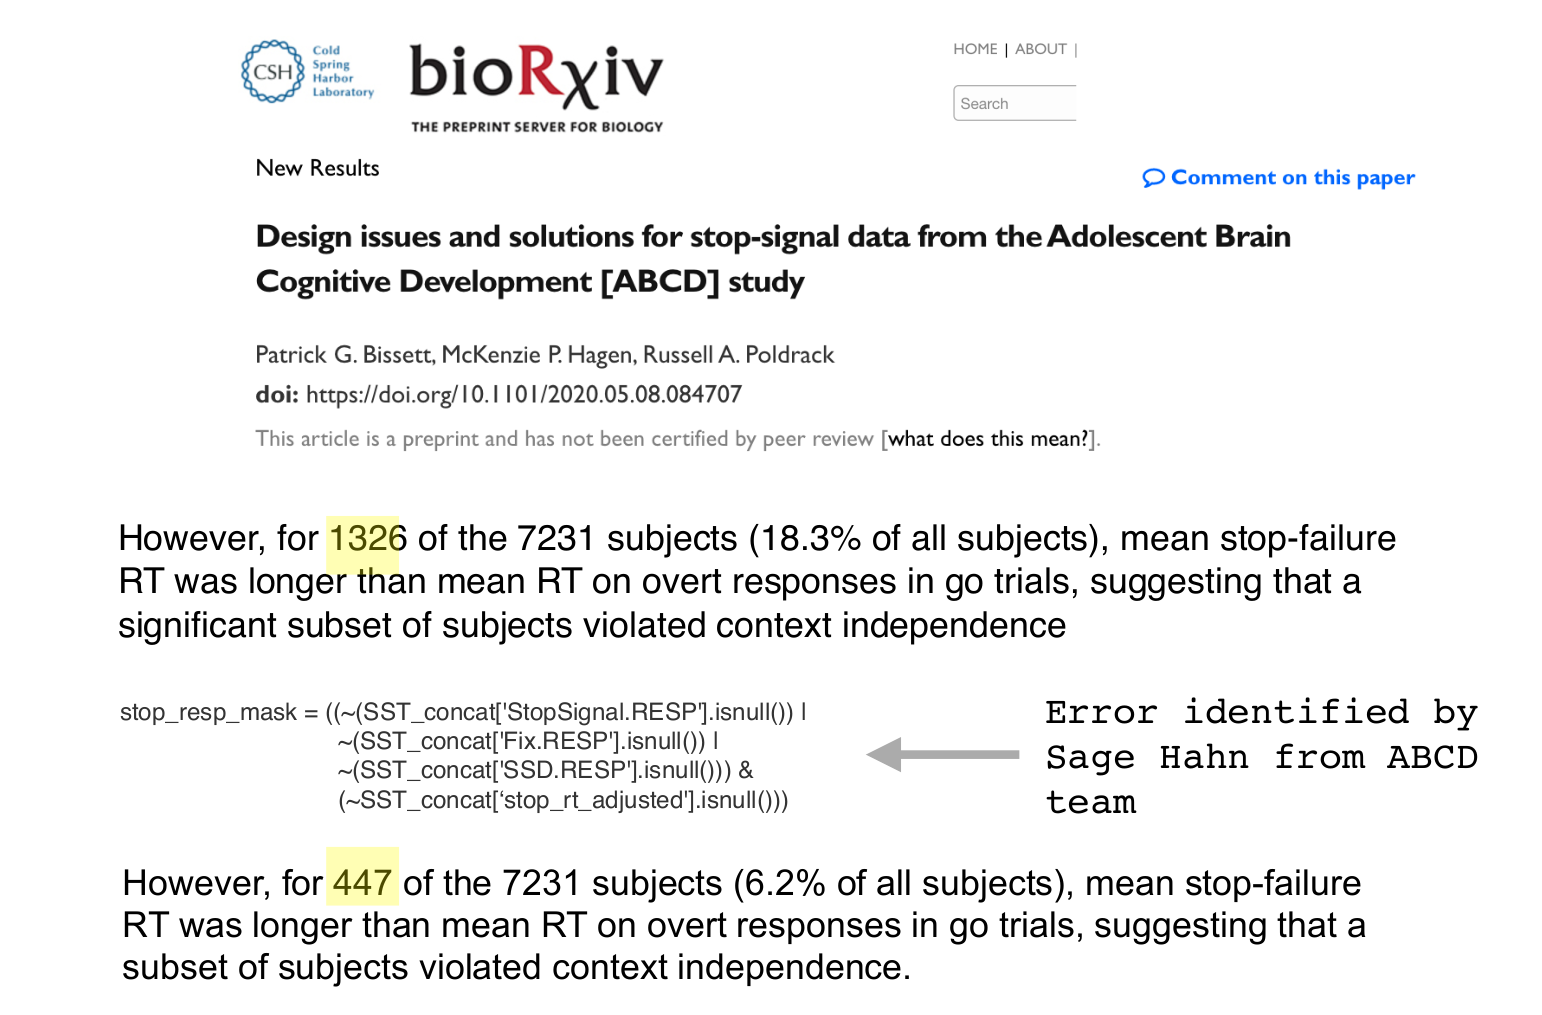
Software errors hit home
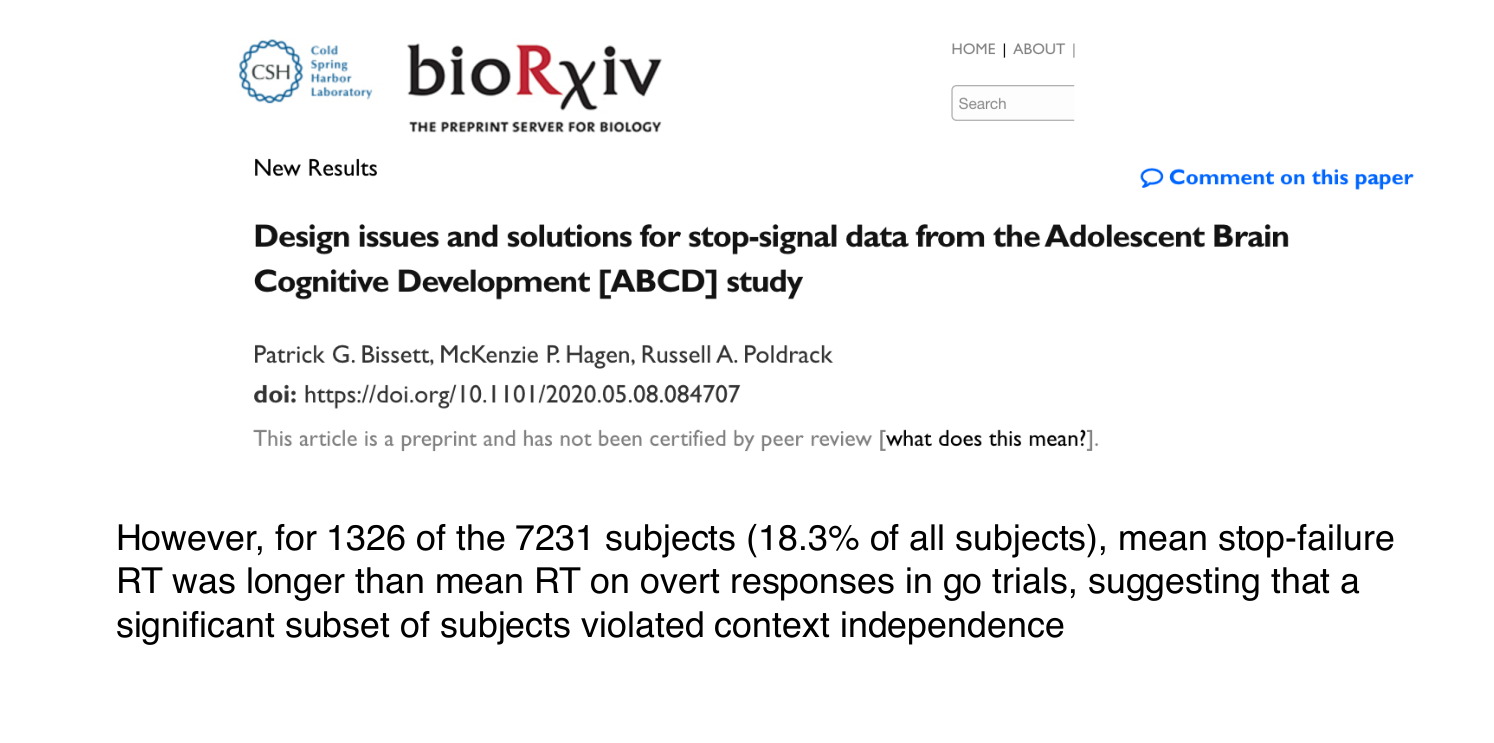
http://reproducibility.stanford.edu/coding-error-postmortem/
Software errors hit home
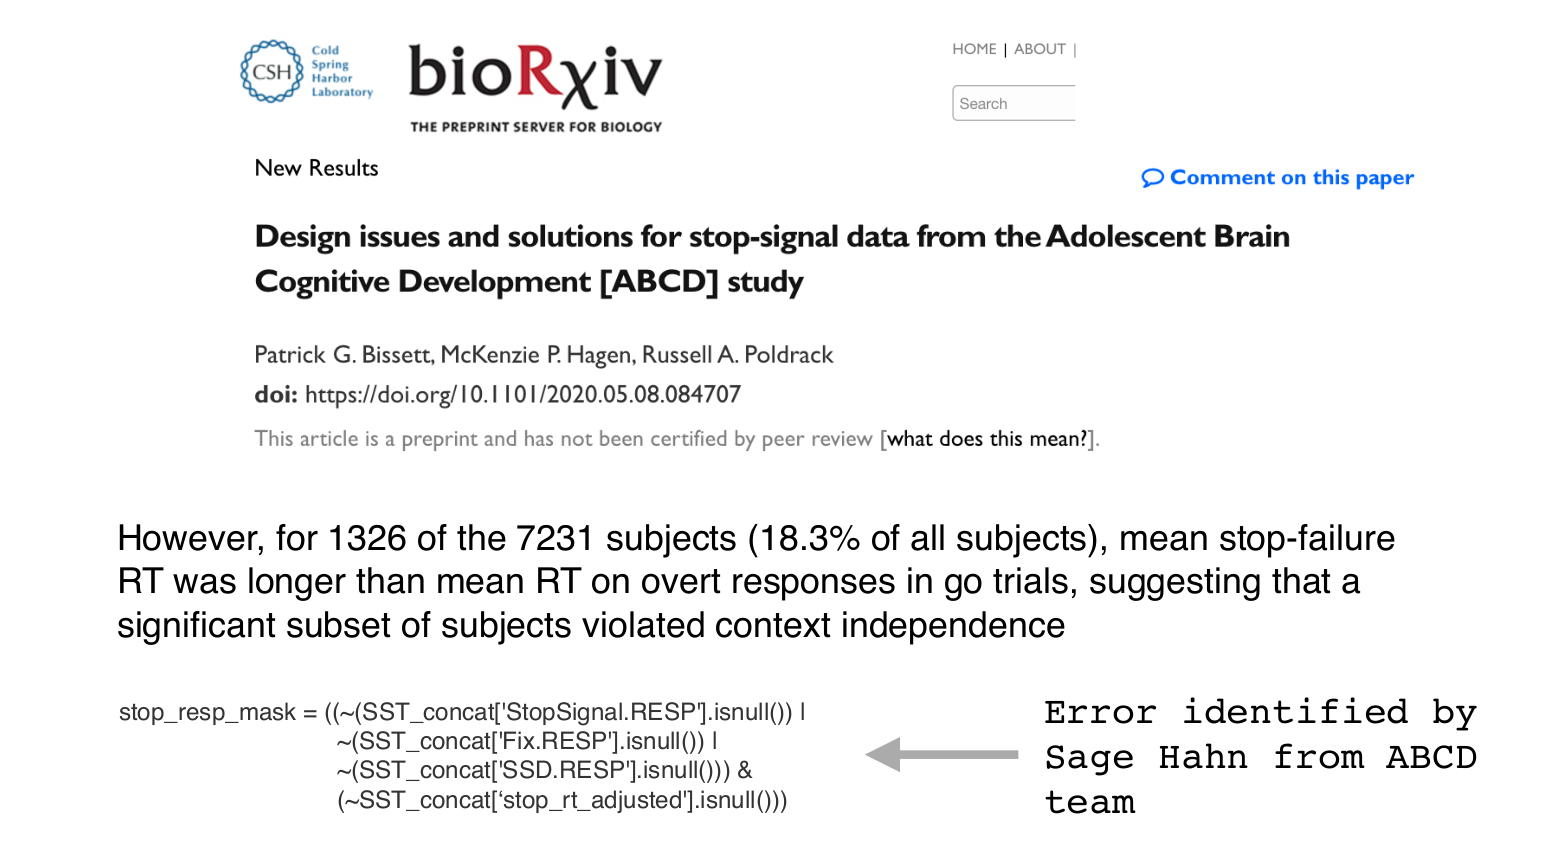
http://reproducibility.stanford.edu/coding-error-postmortem/
Software errors hit home
http://reproducibility.stanford.edu/coding-error-postmortem/
Bug-hacking
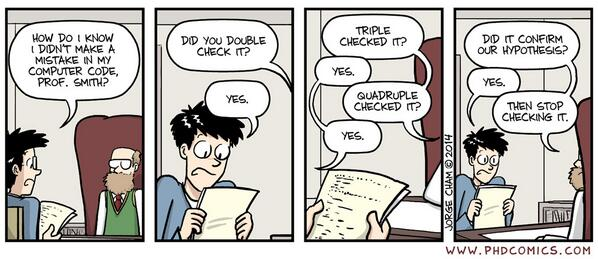
- Bugs that confirm our predictions are less likely to be uncovered than bugs that disconfirm them
The principle of assumed error
- Whenever you find a seemingly good result (e.g. one that fits your predictions), assume that it occurred due to an error in your code
- Protects from “bug hacking”
http://www.russpoldrack.org/2016/08/the-principle-of-assumed-error.html
Coding for reproducibility
- High quality code should be:
- Readable
- Robust
- Modular
- Well-tested
- Coding is a craft
- The only way to improve one’s skills is through consistent and deliberate practice

https://software-carpentry.org
Coding style
- “code is read much more often than it is written” so readability counts (G. van Rossum)
- Nearly all languages have conventions for coding style
- Following them makes your code easier for others to understand
- “others” includes your future self!
- There are also language-independent principles of software design

Commenting is not a magic balm for bad code
- Comments should help the reader to know as much as the writer knows about the code
- Should express intention when it’s not obvious
- “Clear and expressive code with few comments is far superior to cluttered and complex code with lots of comments” (Robert Martin, Clean Code)
- “Don’t comment bad code — rewrite it” (Kernighan & Plaugher)
Code quality analysis and repair
- Static analysis (pylint, flake8, etc)
- Checks for errors and adherence to Python style guidelines
- Can be run automatically within editor any time code is saved
- Automated formatting tools can help ensure good code formatting
- black/blue for Python
- Collaborator: “Fixing the style made your code so much easier to read!”

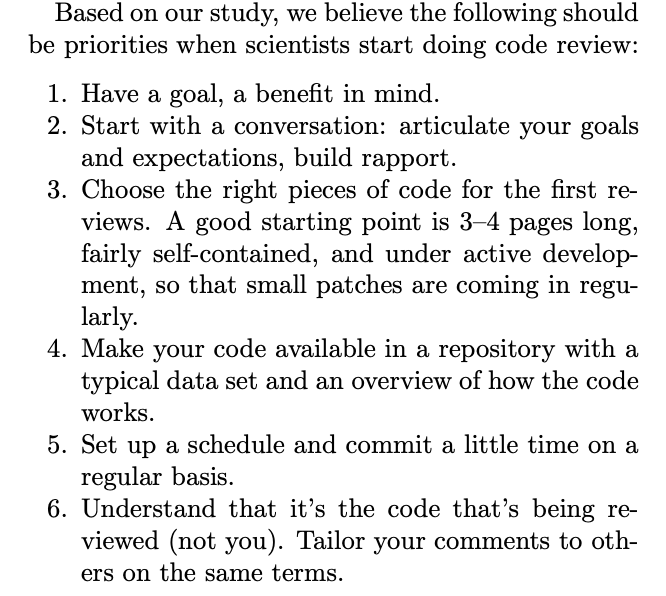
Code review
- Linus’s law
- “given enough eyeballs, all bugs are shallow.”
- Code review as a group is a great way to learn coding skills
- AI tools have become very good at code review
Software testing
- Smoke tests
- Does everything run without exploding?
- Sanity checks
- Are values within reasonable ranges?
- Unit tests
- Does the function do what it is supposed to do?
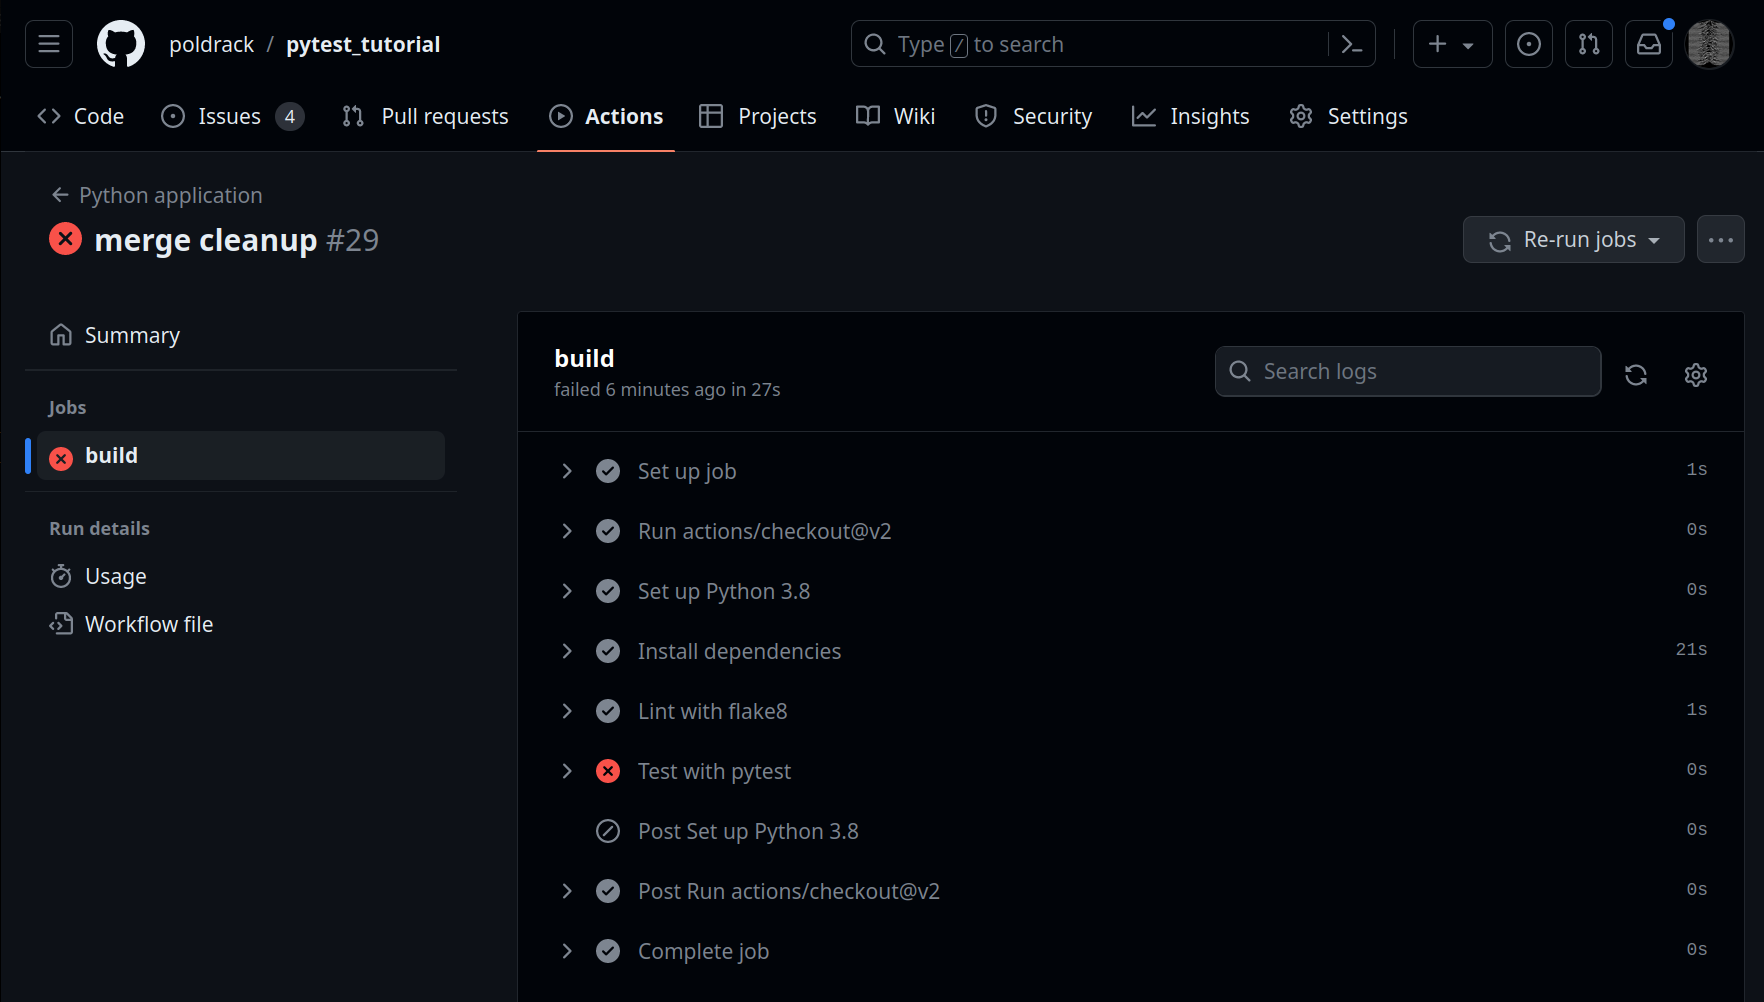
https://github.com/poldrack/pytest_tutorial
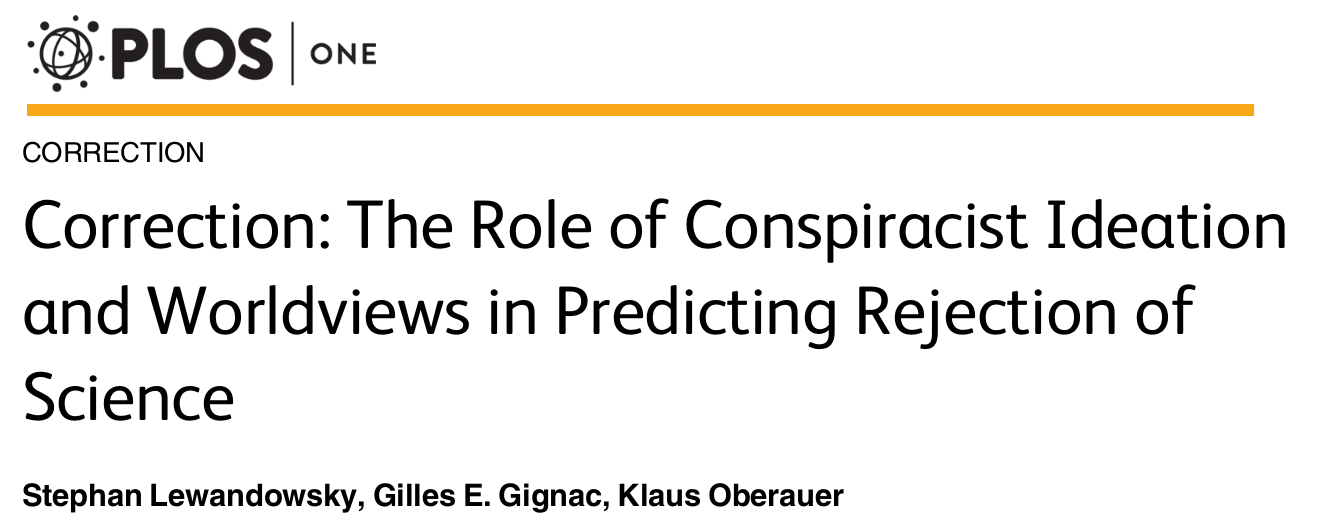
The dataset included two notable age outliers (reported ages 5 and 32757).
Specifically, the statement on page 9 “age turned out not to correlate with any of the indicator variables” is incorrect. It should read instead “age correlated significantly with 3 latent indicator variables (Vaccinations: .219, p < .0001; Conservatism: .169, p < .001; Conspiracist ideation: -.140, maximum likelihood p < .0001, bootstrapped p = .004), and straddled significance for a fourth (Free Market: .08, p%.05).”
In [1]: age=32757

In [2]: assert age>12 and age<120
------------------------------------------------
AssertionError                            Traceback (most recent call last)
<ipython-input-2-37de876b5fda> in <module>()
----> 1 assert age>12 and age<120

AssertionError:
Test-driven development
- Write test cases based on the intended behavior of the code
- Run tests and continue to modify code until the tests pass
- Add tests for any new requirements
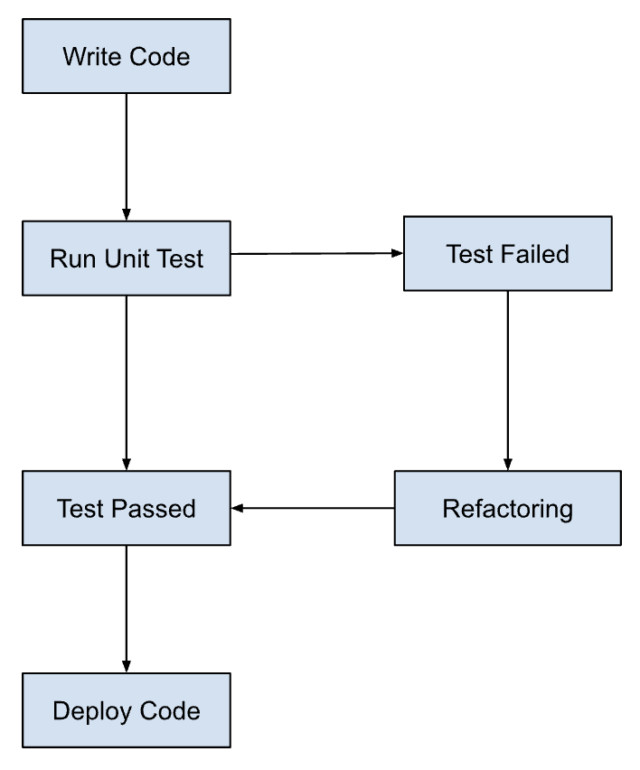
https://www.browserstack.com/guide/tdd-vs-bdd-vs-atdd
Automated testing
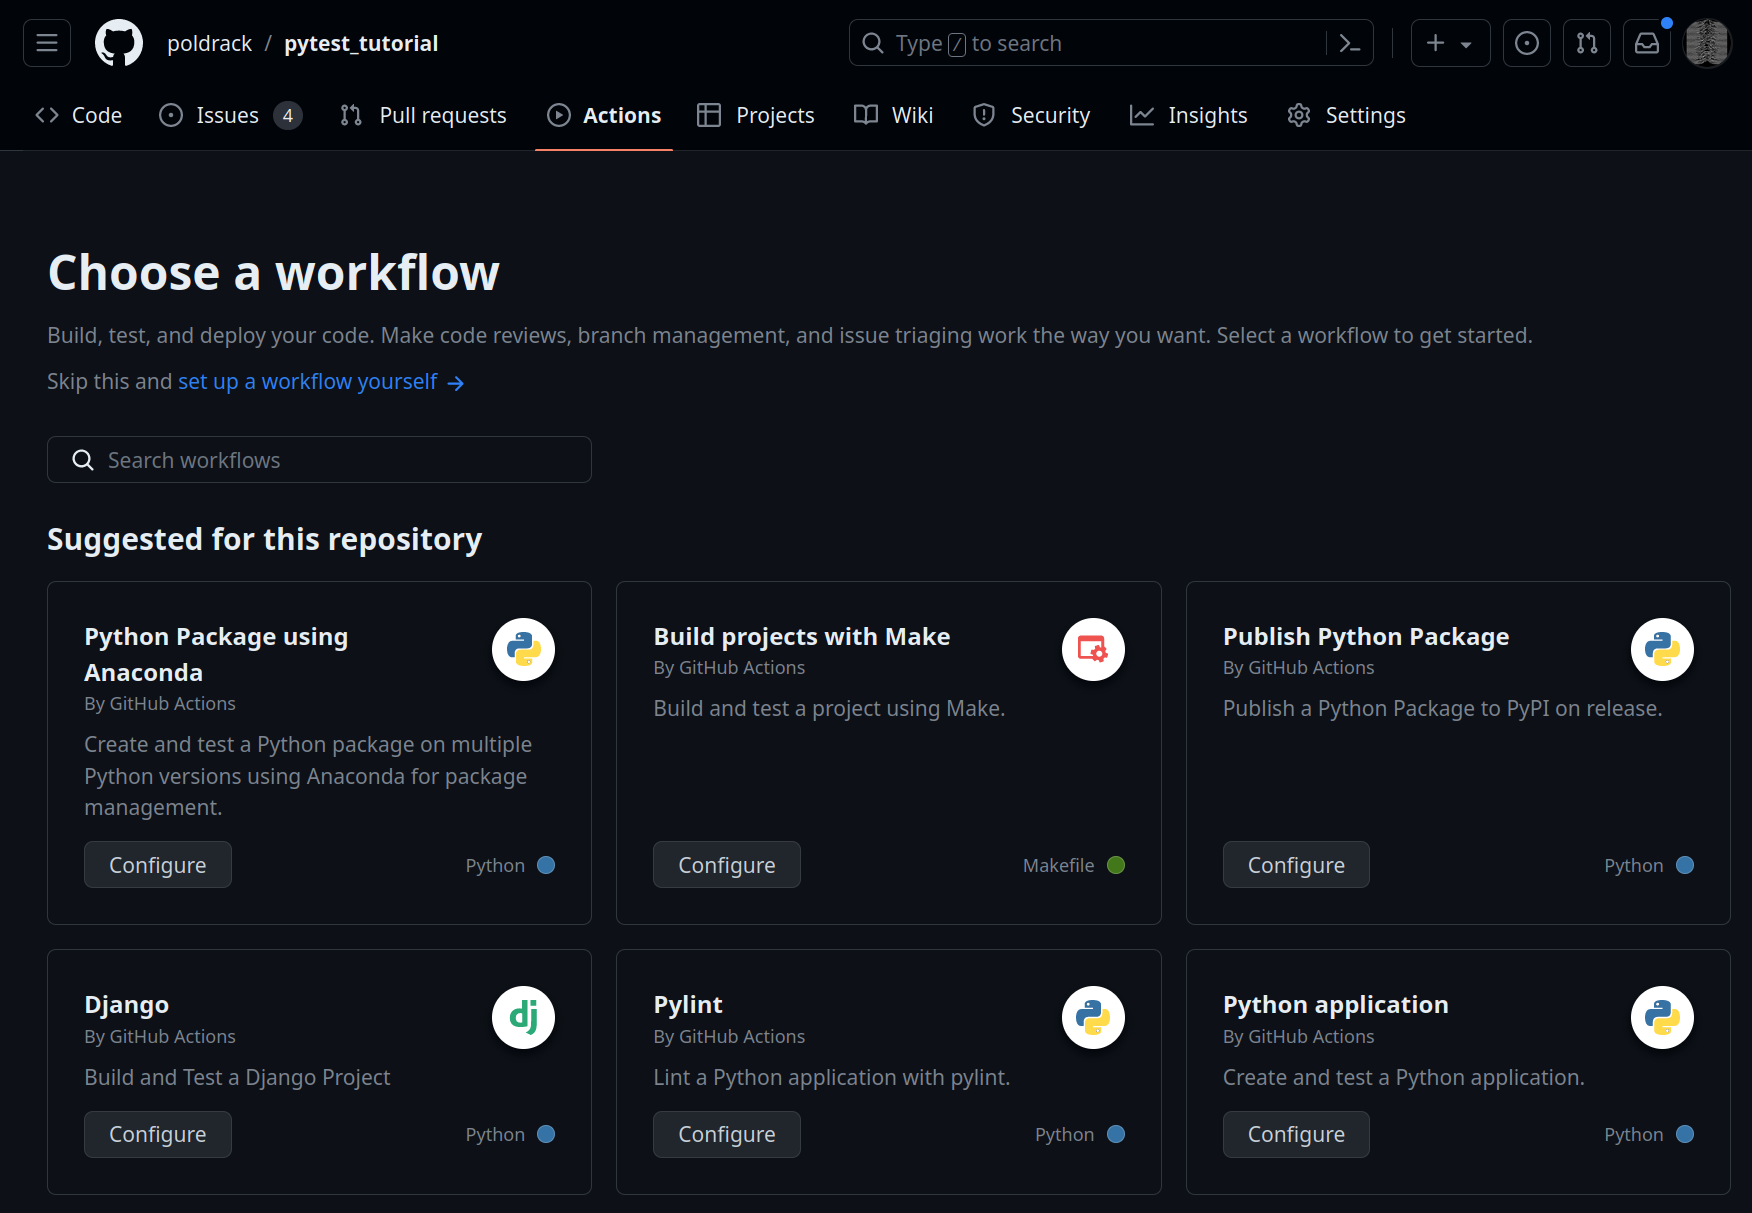
Automated testing
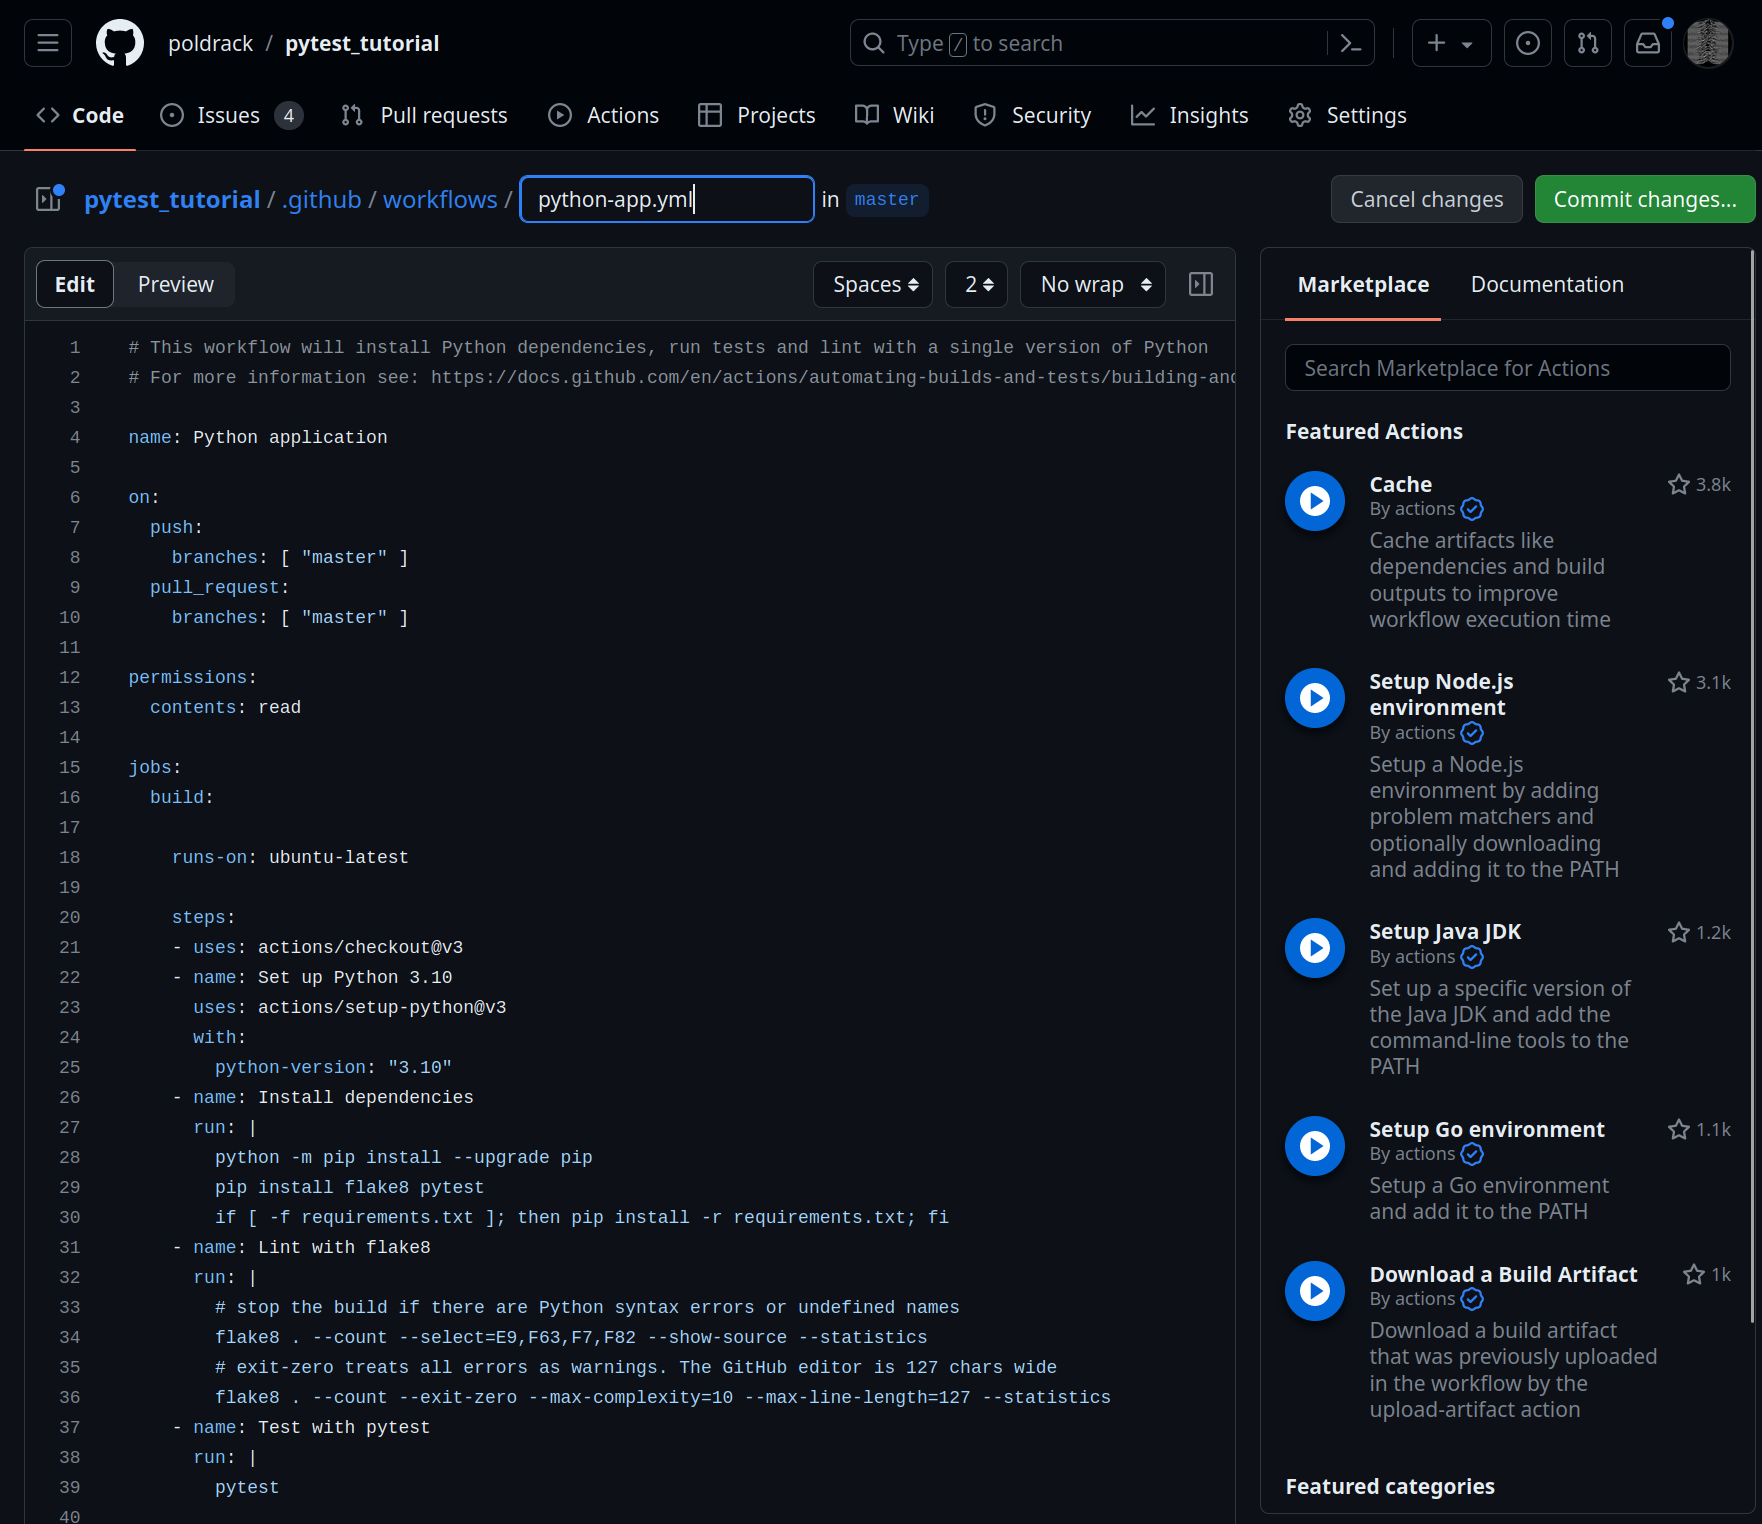
Automated testing
https://poldrack.github.io/BetterCodeBetterScience
New testing sections daily this week at https://russpoldrack.substack.com/
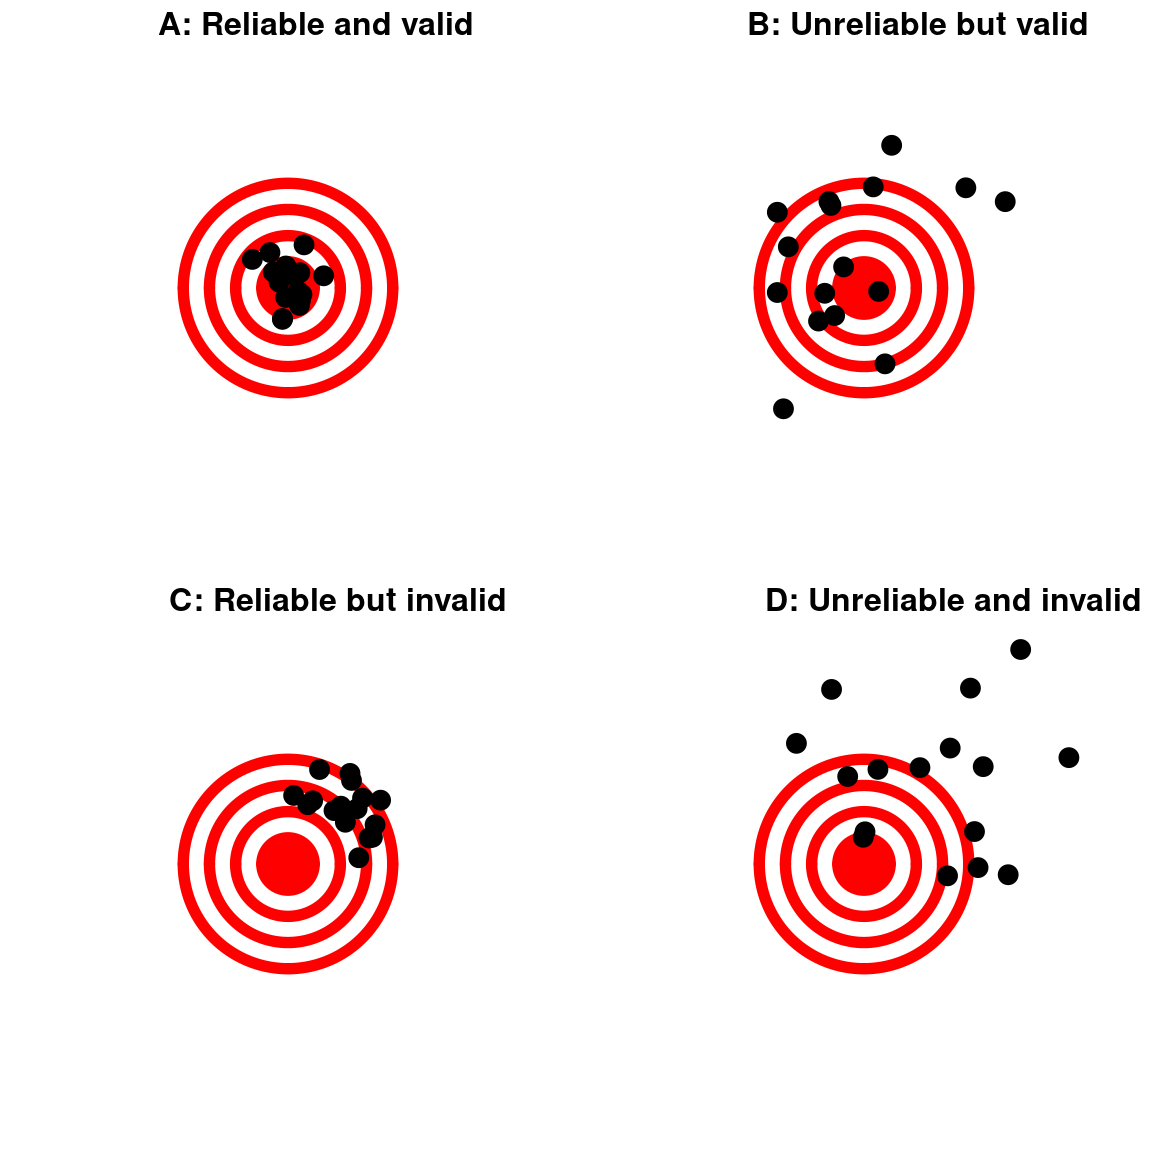
Reproducibility vs. validity
- Reproducibility does not ensure validity
- The code could be reproducibly wrong!
Code validation
- Parameter recovery
- generate synthetic data with a known answer, and make sure that your code can recover the known answer
- Best to do this before ever touching the real data!
- Null/randomization testing
- Generate data with no effect (either synthetic or via randomization of real data) and make sure that no effect is found
- There are increasingly powerful frameworks for generating simulated data
- Python: Synthetic Data Vault (https://sdv.dev/SDV/)
Conclusions
- Cognitive neuroscience has a reproducibility problem
- Likely not very different from other areas of science with complex computational workflows and large datasets
- Statistical power is one key to solving the problem
- Software engineering tools can help ensure reproducibility and validity of complex analyses
- The tools that you will learn at Neurohackademy will help you do better science!
https://poldrack.github.io/talks-Neurohackademy/