Improving the validity of brain-behavior associations
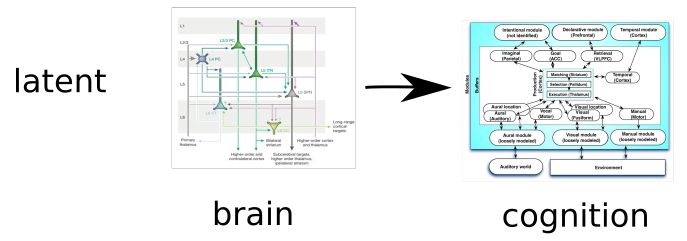
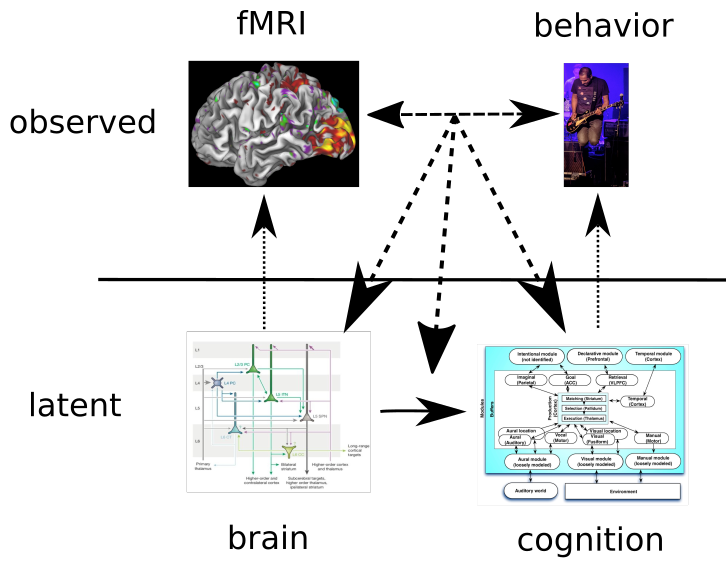
What does a brain-behavior association mean?

What does a brain-behavior association mean?

What does a brain-behavior association mean?

What does a brain-behavior association mean?


Efficiency: A thought experiment
- A Prius and a Porsche both drive from San Francisco to Los Angeles via the same route at the same speed.
- The Prius uses half as much fuel as the Porsche. How do we explain this?

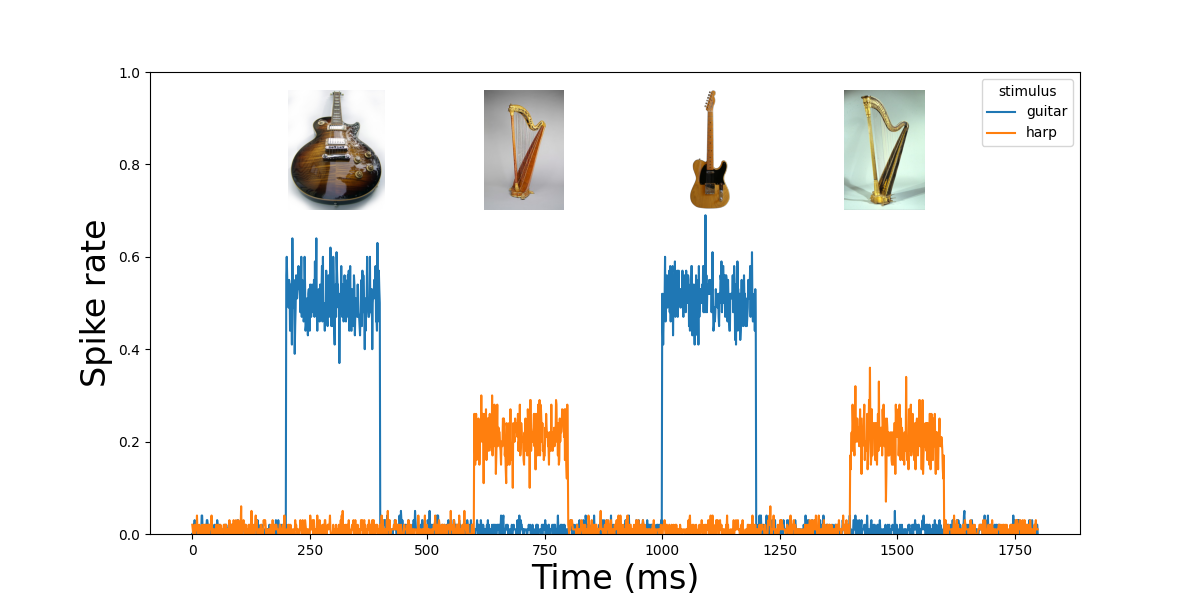
Difference in intensity of neural activity

Difference in duration of neural activity
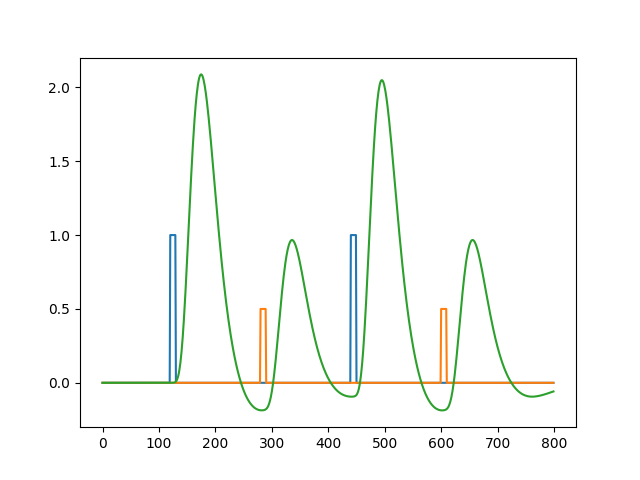
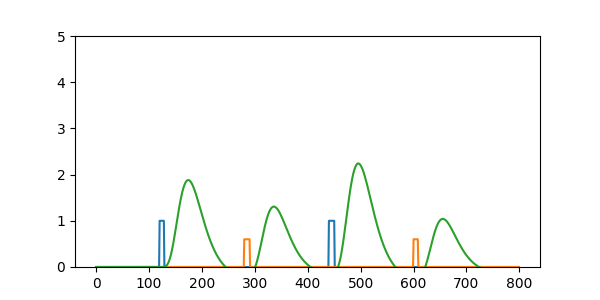
Same duration, different amplitude
Same amplitude, different duration
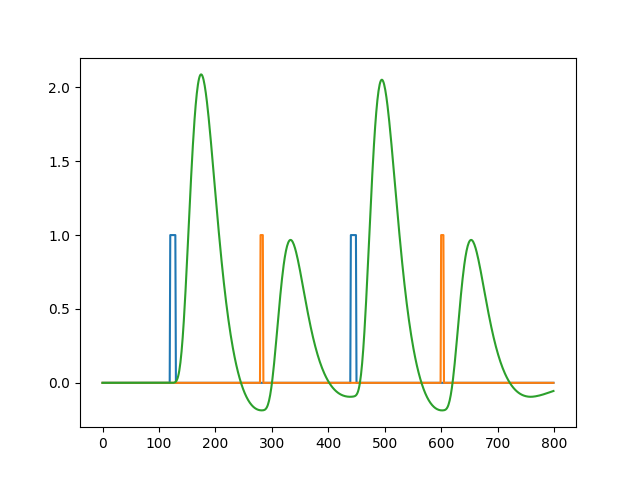
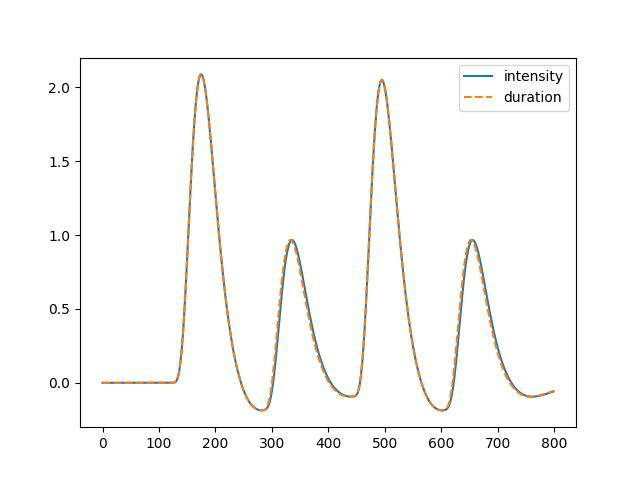
The effects of amplitude and duration are indistinguishable in the fMRI signal
The response time paradox
- From the standpoint of fMRI, these same RT differences reflect a potential confound
- We can’t tell whether the differences in activation are truly due to differences in neural computation, or simply due to a “time on task” confound
- Known since Grinband et al. (2008)
Mumford et al, 2023

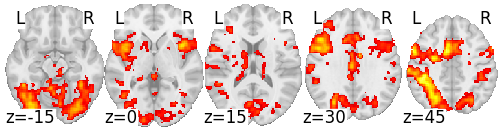
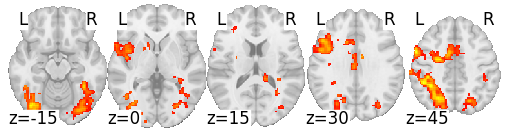
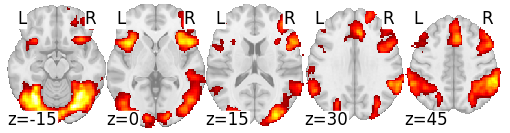
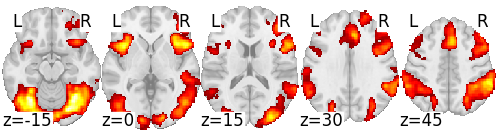
Response time correlates in fMRI are very strong
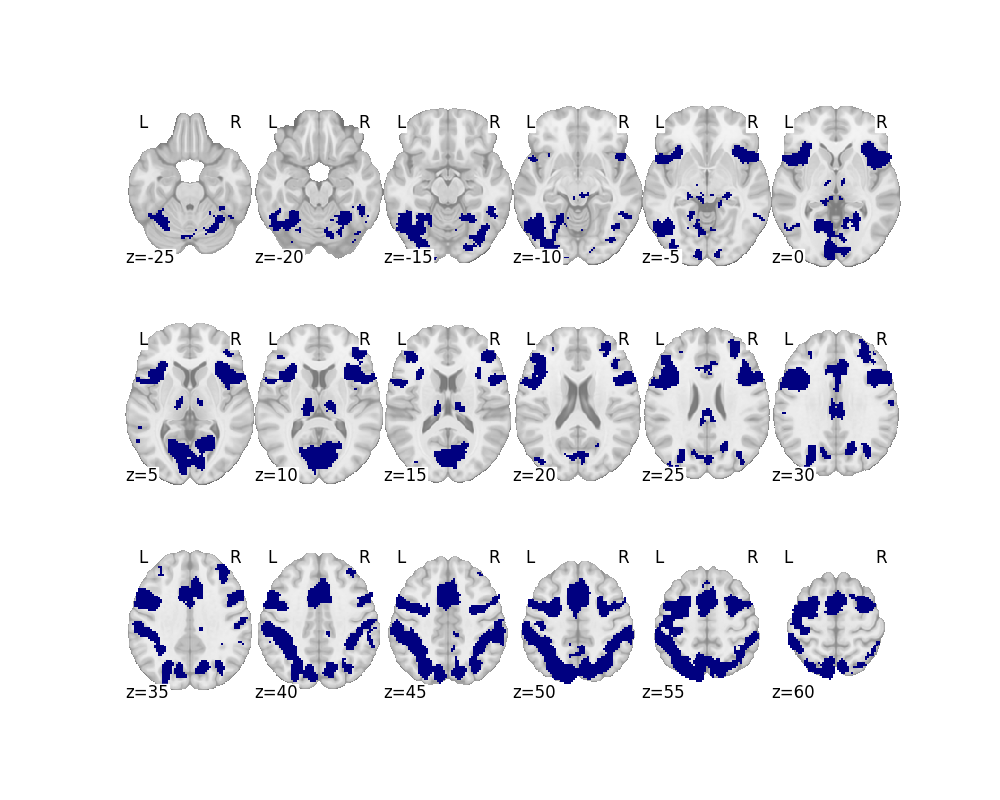
Conjunction across 7 tasks
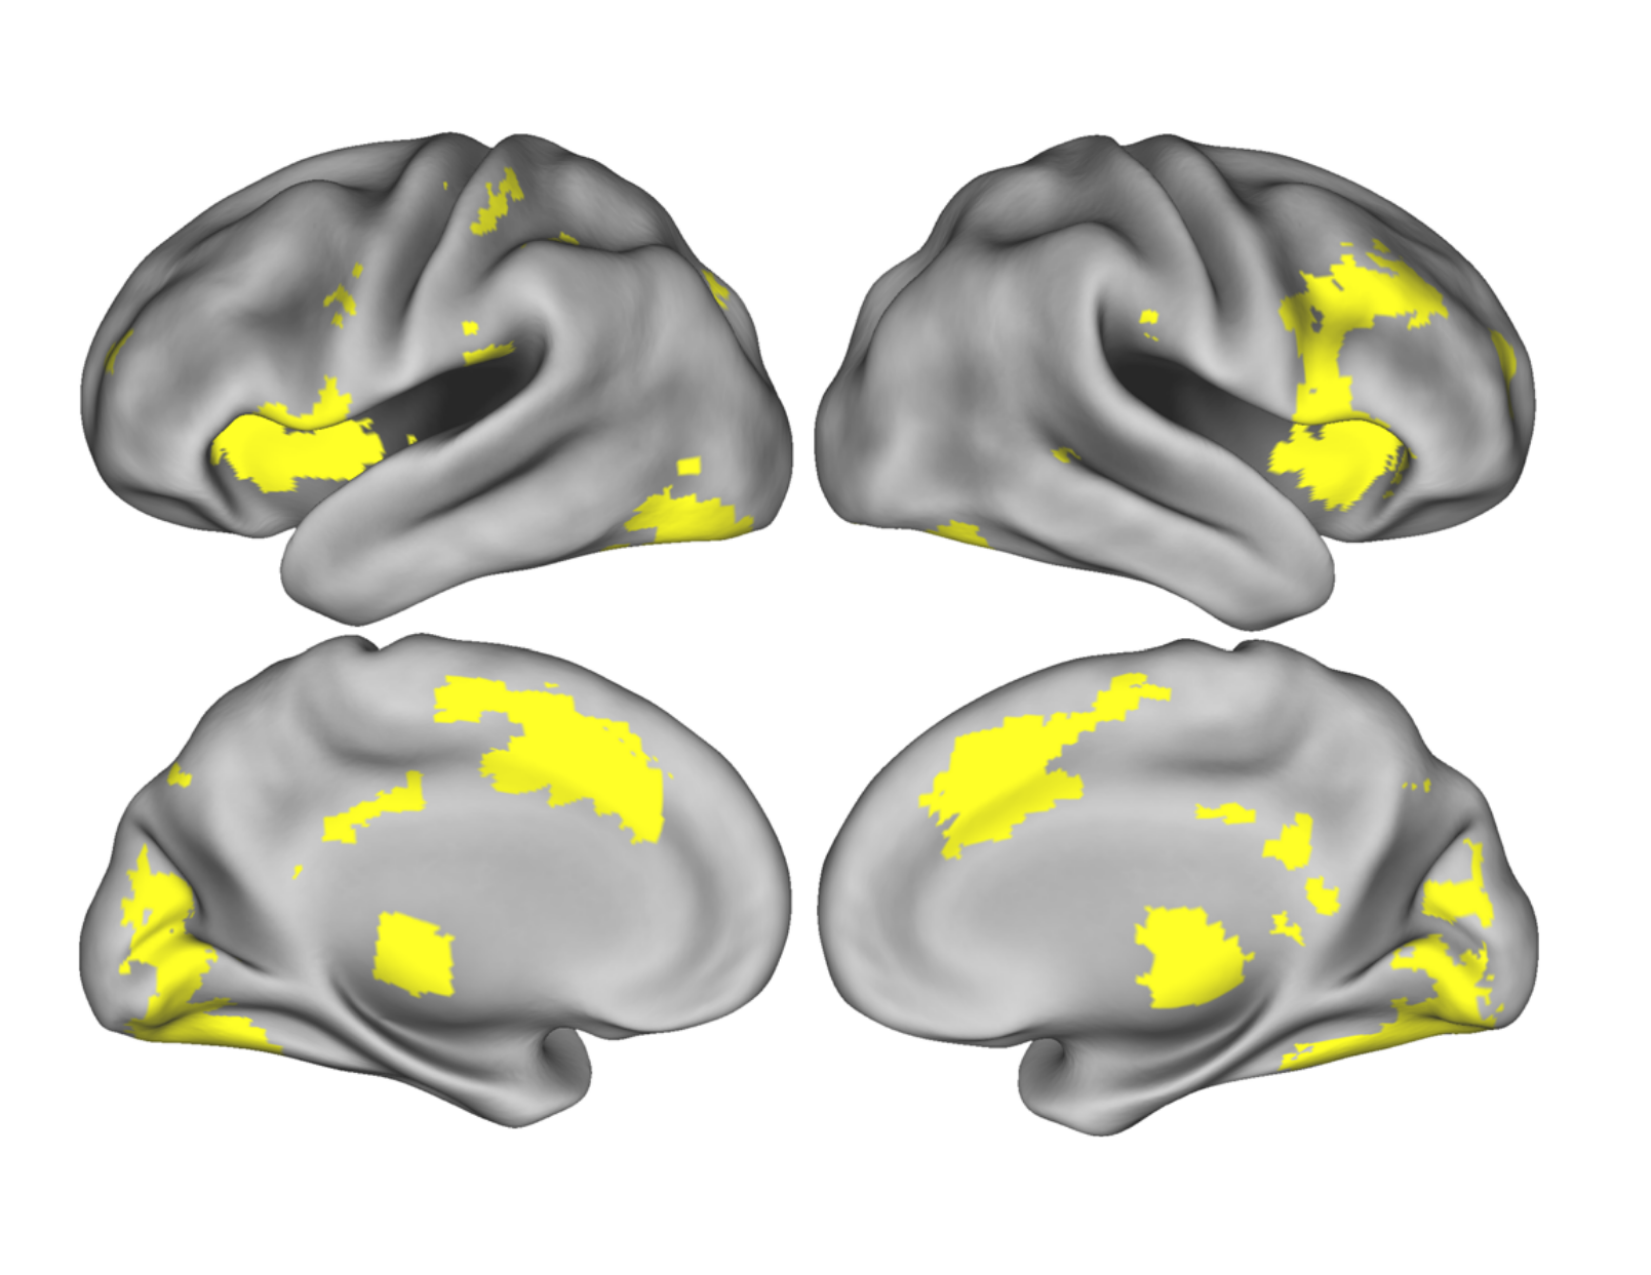
Conjunction across 4 tasks
Yarkoni et al., 2009
Mumford et al, 2023
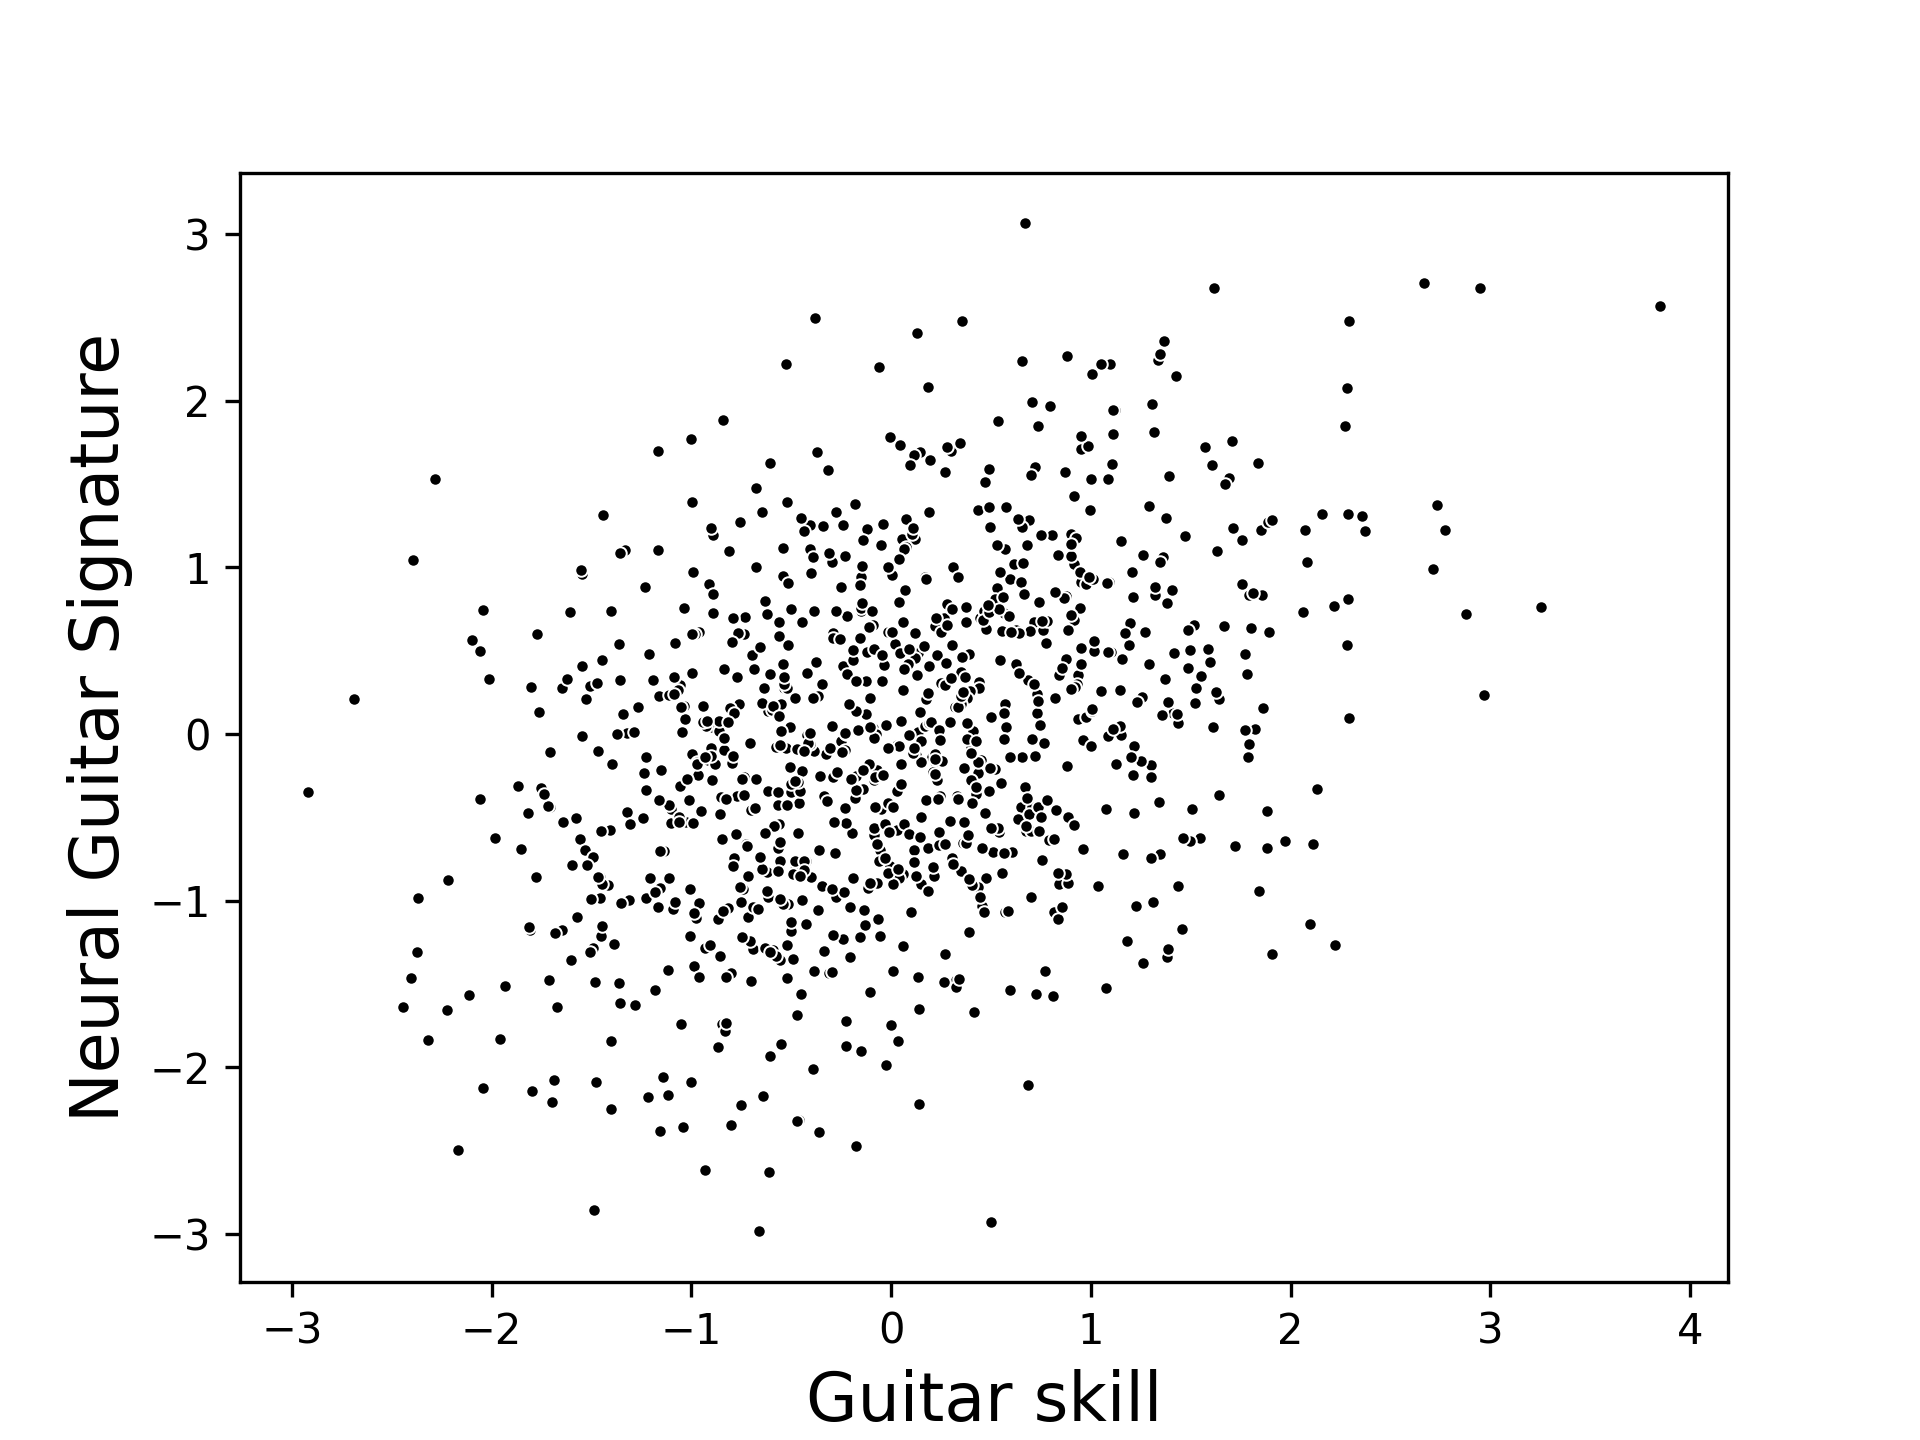
What about brain-behavior associations?
- Under the standard analysis approach (ignoring RT), if there are:
- differences in the overall BOLD response (regardless of condition) across people
- variability in the RT difference between conditions across people

What about brain-behavior associations?
- Under the standard analysis approach (ignoring RT), if there are:
- differences in the overall BOLD response (regardless of condition) across people
- variability in the RT difference between conditions across people
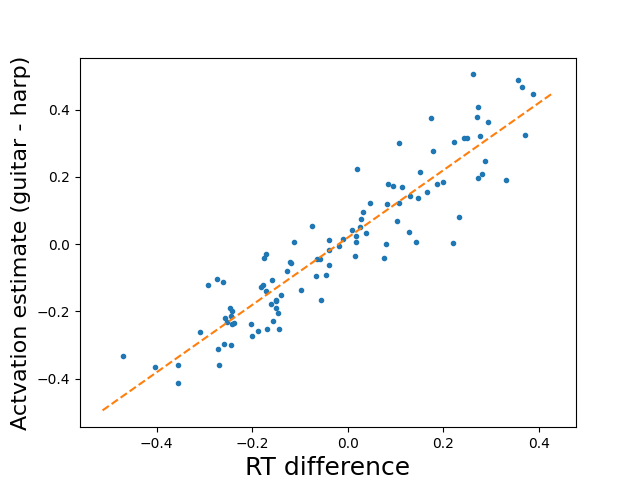
- This can induce an artifactual correlation between activation (between-condition comparisons) and the RT difference.
- Even if the average RT difference between conditions is zero across subjects!
Mumford et al, 2023
Spurious brain-behavior correlations
- When overall BOLD response (across all conditions) differs by some subject feature (e.g. age), then this can lead to spurious brain-behavior associations with that feature
- Even when there is no true relationship between age and activation (condition differences) or RT!

Mumford et al, 2023
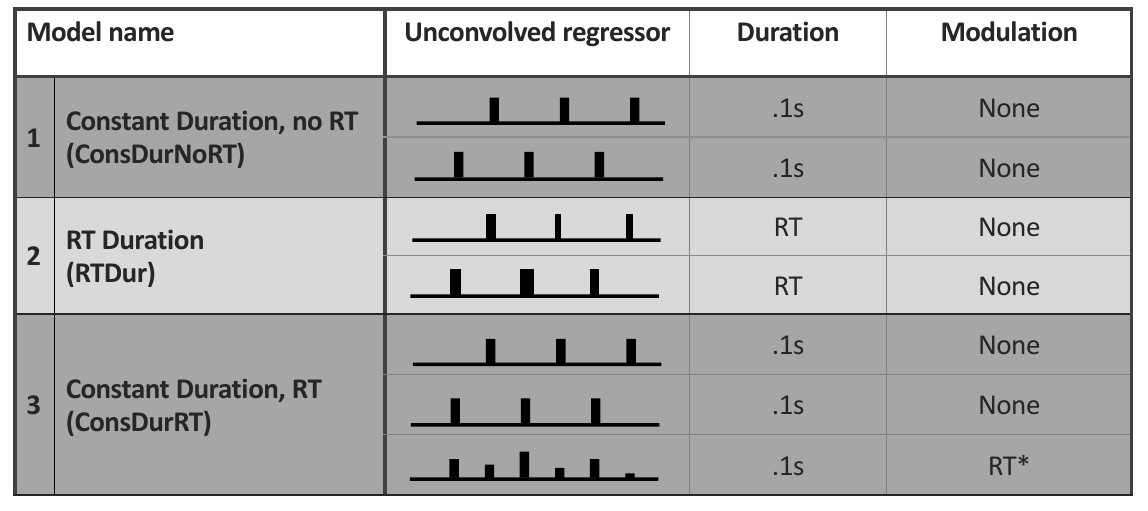
Solution: Model RT at the first level
←
The standard model
←
The Grinband et al. (2008) model
←
The Mumford et al. model
The Constant Duration + RT model allows quantification of the unique contributions of time on task and condition differences
Mumford et al, 2023
Are we throwing out the baby with the bathwater?
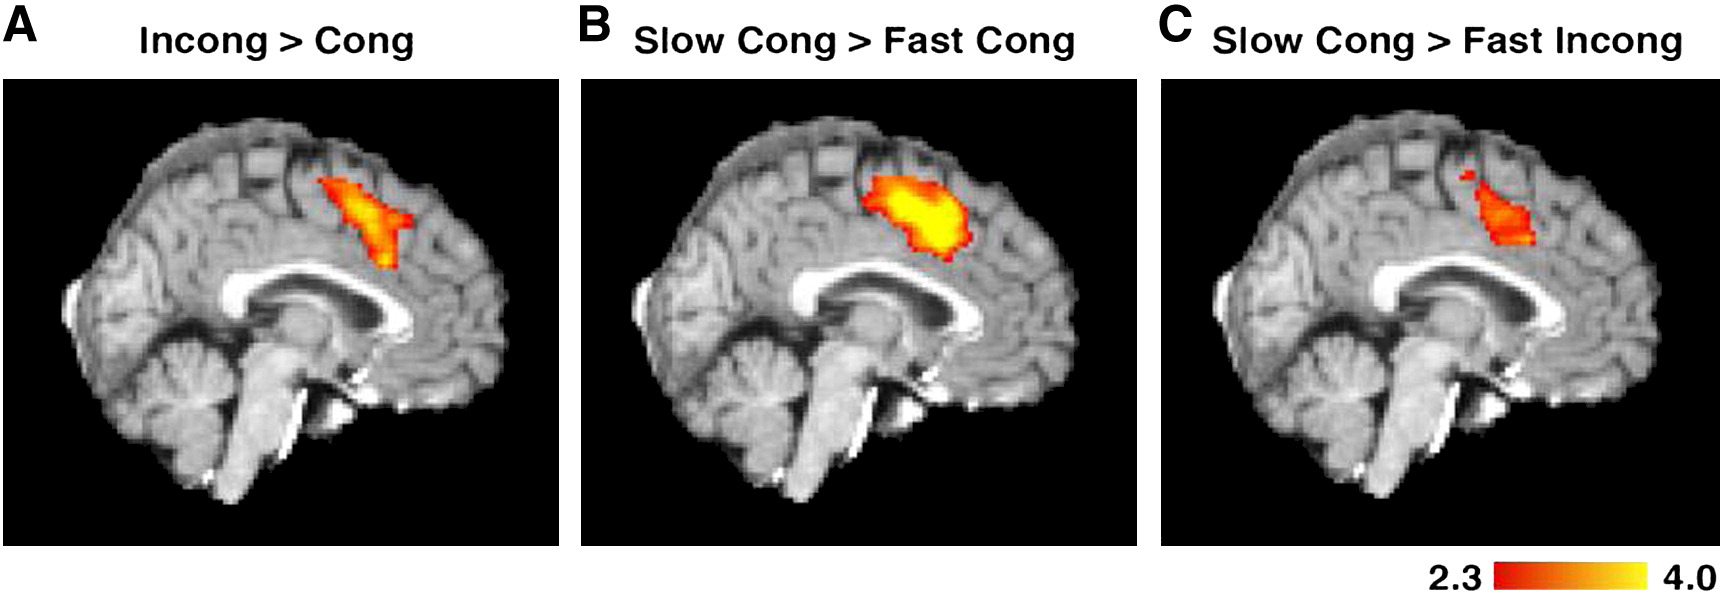
Activation for Stroop effect disappears after removing RT effect
Grinband et al., 2011 (N = 23)
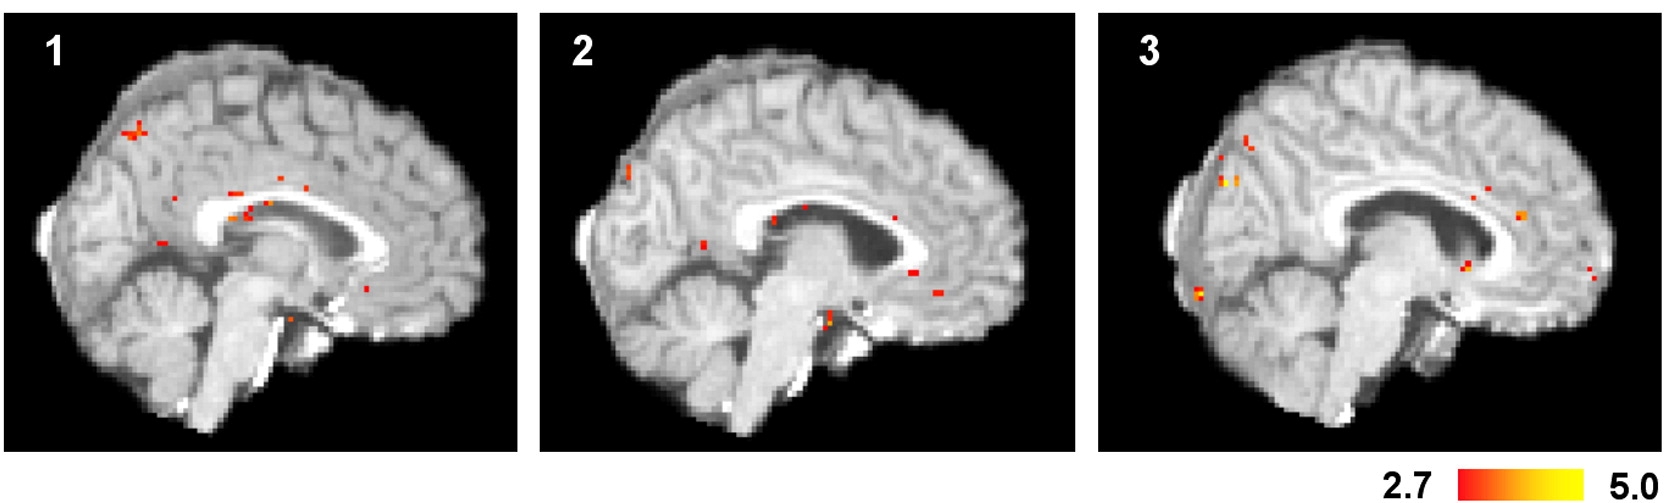
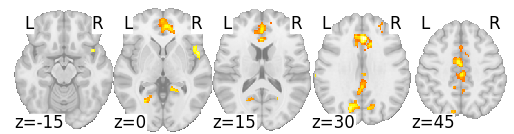
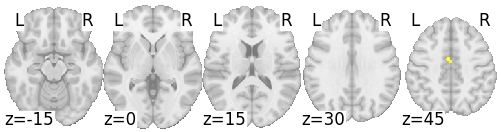
With sufficient power, we can (sometimes) find specific effects after removing RT
Without RT modeling
Stroop
(inc - con)
With RT modeling
With sufficient power, we can (sometimes) find specific effects after removing RT
Without RT modeling
Stroop
(inc - con)
With RT modeling
Task switching
(TS - CS)
With sufficient power, we can (sometimes) find specific effects after removing RT
Without RT modeling
Stroop
(inc - con)
With RT modeling
Task switching
(TS - CS)
Stop signal
(FS - go)
Bissett et al., unpublished
Modeling RT at the first level prevents suprious relations with RT and other correlates of BOLD response

Without first-level RT modeling:
| t | p | |
|---|---|---|
| Age | 2.698 | 0.008 |
With first-level RT modeling:
| t | p | |
|---|---|---|
| Age | 0.562 | 0.575 |
Mumford et al, 2023
Confound modeling is not a magic balm
- There is a general sense evident from brain-behavior association studies that regression can magically cure all that ails us
- Simply adding regressors will not fix many problems, and can cause others
- Collider bias
- When a confound regressor is a common effect of X and Y variables
- Measurement error (Westfall & Yarkoni, 2016)
- When confound variables are measured with error, including them can inflate error rates (sometimes to nearly 100%)
- Collider bias
- We need a greater focus on causal justification for our statistical models (Wysocki et al., 2022; Kopal et al., 2023)

Acknowledgments
The Poldrack Lab

Jeanette Mumford
![]()
![]()
![]()
Funding